Non-heap memory, metaspace climbs until system is fully unresponsive

Good morning. I am having continuously increasing non-heap memory usage and metaspace usage, and I am at a loss for how to resolve it. This usage is resulting in deeply disruptive, network-severing server meltdowns. I could use some suggestions – my mind is very open to ideas on how to address this. I can’t tell if this is a Lucee bug (seems unlikely, but possible), an issue with my server setup (certainly possible) or, even, if I am approaching my Lucee .cfm code in a way that’s causing problems (also possible).

Server Setup Background

I’ve been struggling for about two months with a shift to a new server setup for my Lucee application. My original server was Ubuntu 18 with Lucee 5.4.3.16 and MySQL 5.7, NGINX reverse proxy, Java version 11, 1 vCPU, 2 GB RAM. For several years it was a remarkably stable operation. With Ubuntu 18 reaching EOL, I needed to move to a new server.

This was a challenge on its own, but I appreciate all of the people who have been patient with me as I attempt to get it set up. I’ve made five different attempts at a new server.

I’ve done manual builds on about four different new AWS Lightsail instances. Based on feedback from this thread as well as lots of patient assistance from Ortus members here and here, I set up my current server (fifth attempt) on CommandBox.

The current server is running Ubuntu 20.04, Lucee 5.4.4.38 served through CommandBox (with embedded server enabled), NGINX as a reverse proxy, Java version 11, and MySQL 8.0 (this is an upgrade, too, from 5.7) as a database, with 2 vCPU (an increase!) and 2 GB RAM.

The server starts and performs like normal (quite well, really) until it reaches the thermonuclear memory meltdown at which point the only recovery is through forcing a 10-minute shutdown through the AWS Lightsail dashboard.

My Application Background

My Lucee web application is a personal website that processes and displays weather data, some webcam images and other small things. It is a hobby project. It receives almost no traffic. It has about 20-25 scheduled tasks to manage the data and image processing. There are many, many interactions with MySQL.

Critically: the code has not changed. The code, which was stable (multi-month, no-drama uptime, years of successful operation), remains the same from the old server to the new.

I also copied the exact same lucee server/web configuration from the old, stable instance to the new one, setting-by-setting match.

When moving to the new server, the server launches and operates just like normal until reaches a point – randomly and without pattern or unique triggers (any random page load or shell operation will trigger this) – where it becomes extremely unresponsive. It halts all network activity, monit is unable to function to restart programs, it just enters a state of panic and hangs. I have to use the AWS Lightsail console to reboot, which takes about 10 minutes due to the unresponsiveness of the server.

My code approach

As a hobbyist, I’ve learned CFML in bits and pieces over 20 years. The pages are mostly written in tag-based CFML code (I know that annoys people, but that’s how I learned.)

I’ve never had to worry about “scope declaration” strategy or caching, so haven’t set any of that up. This is not the world’s most complicated set-up, and, again, the server was performing admirably – with room to spare! – for several years.

I am sure that an expert/pro could view my CFML code as “sloppy,” which is fine. I’m open to improving it and adopting better best practices, but, again, in the past, the server did not have these “increasing memory until crash” issues – nothing even close to it.

None of my pages are unusually long-running. I have no long-running MySQL queries. The workload of the application did not change between servers. No additional traffic is hitting it. There are a few hundred .cfm pages, no one page is more problematic than others.

Memory Issues – FusionReactor and JVM Arguments

(Never before have I had to worry about the intricacies of Java’s memory management, either in terminology or in practice. So if I say something “wrong” here, it’s because I’m ignorant.)

As described earlier, the server is reaching (what I think are) “Out of Memory” (OOM) events. I’m not getting the typical Lucee “yellow box” errors about this, I’m getting kern.log events invoking oom-killer (which, btw, doesn’t work, the server will hang unresponsive for eternity unless rebooted.) All network traffic halts and the server seizes up entirely – monit can’t even close things.

Both old and new servers have these Java options (from server.json, also note that the server exhibits the same behavior whether these JVM arguments are enabled or not)):

"JVM":{
        "heapSize":"512",
        "properties":{
            "java.awt.headless":"true"
        },
        "args":[
            "-XX:+UseConcMarkSweepGC"
        ]
    },

I’ve installed FusionReactor trials to see what I can find out about memory space, based on the advice I’ve seen throughout the internet and from people like @carehart.

With a lot of of influence from @carehart’s response here, along with other threads he and others have written, I’ve used the tools within FusionReactor to gain insight into Memory usage within Lucee.

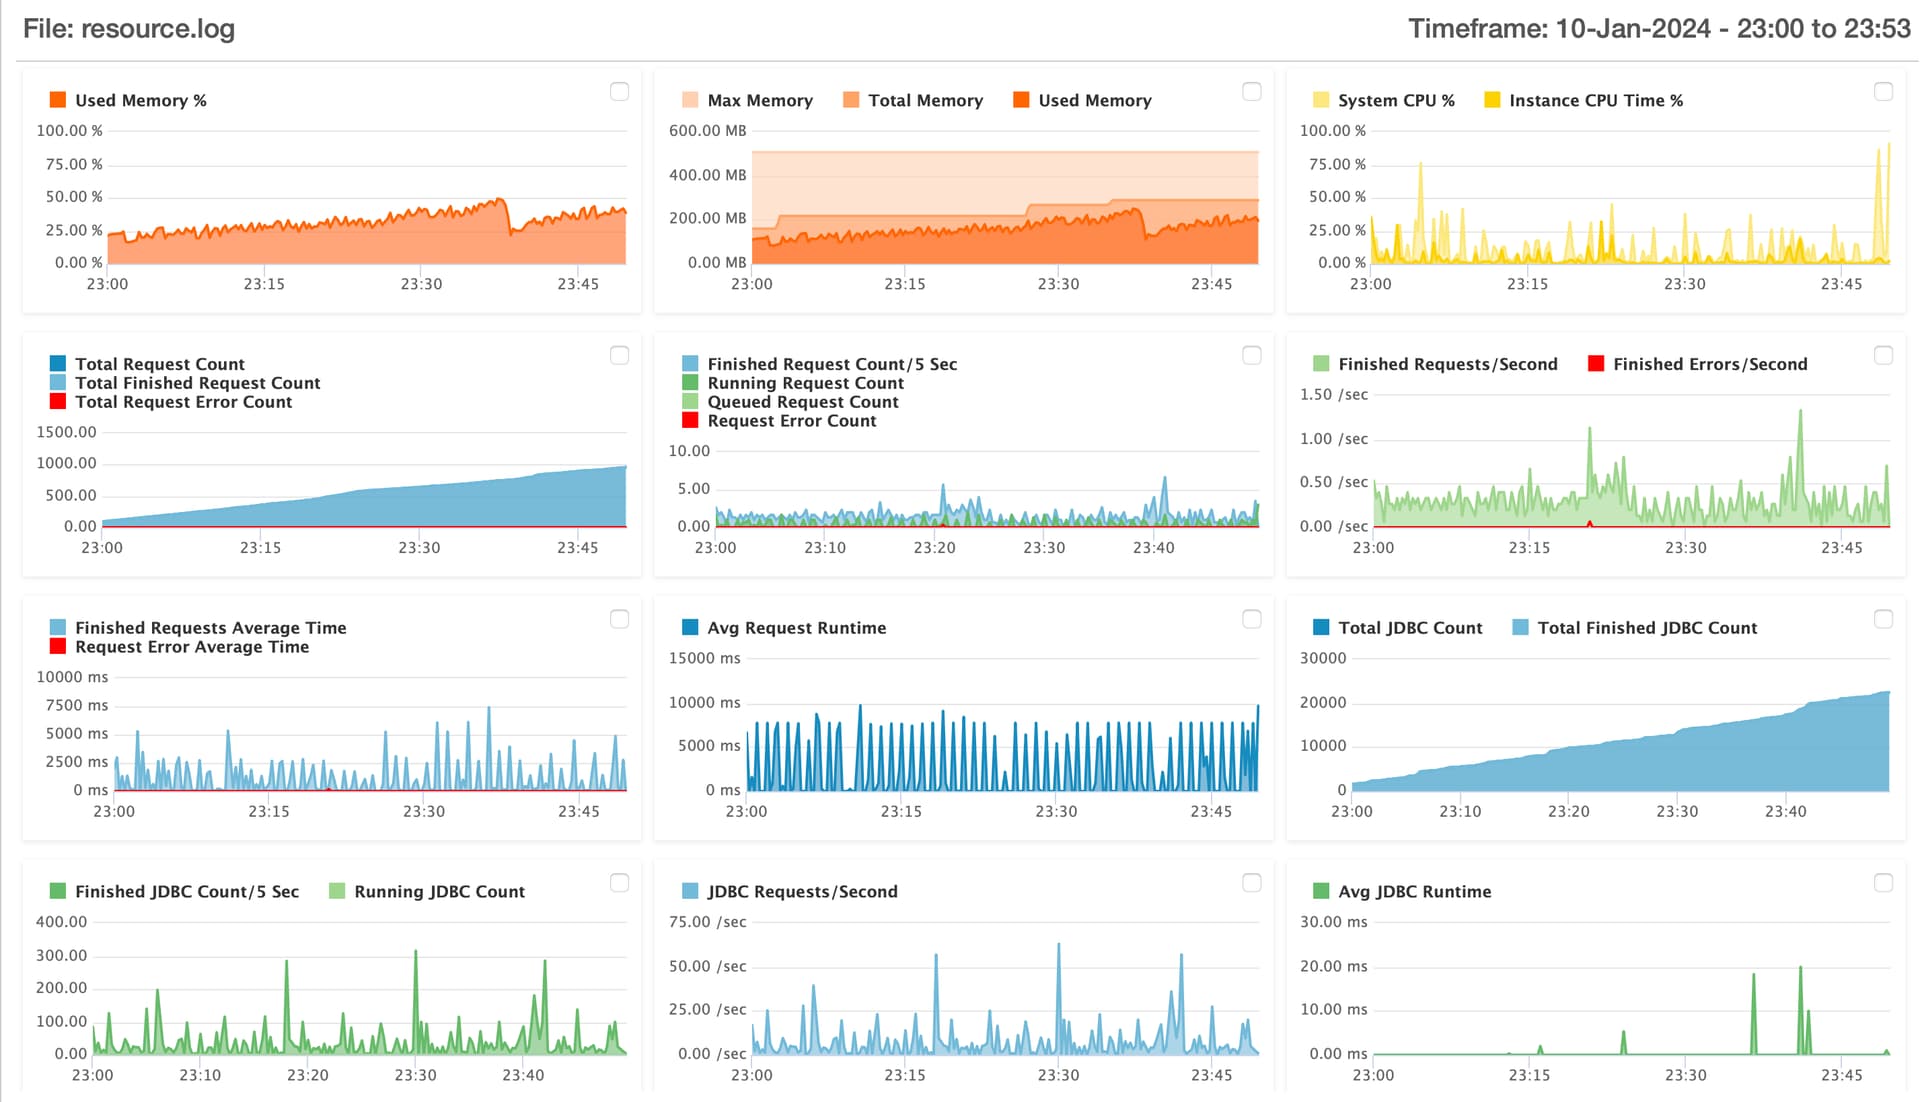
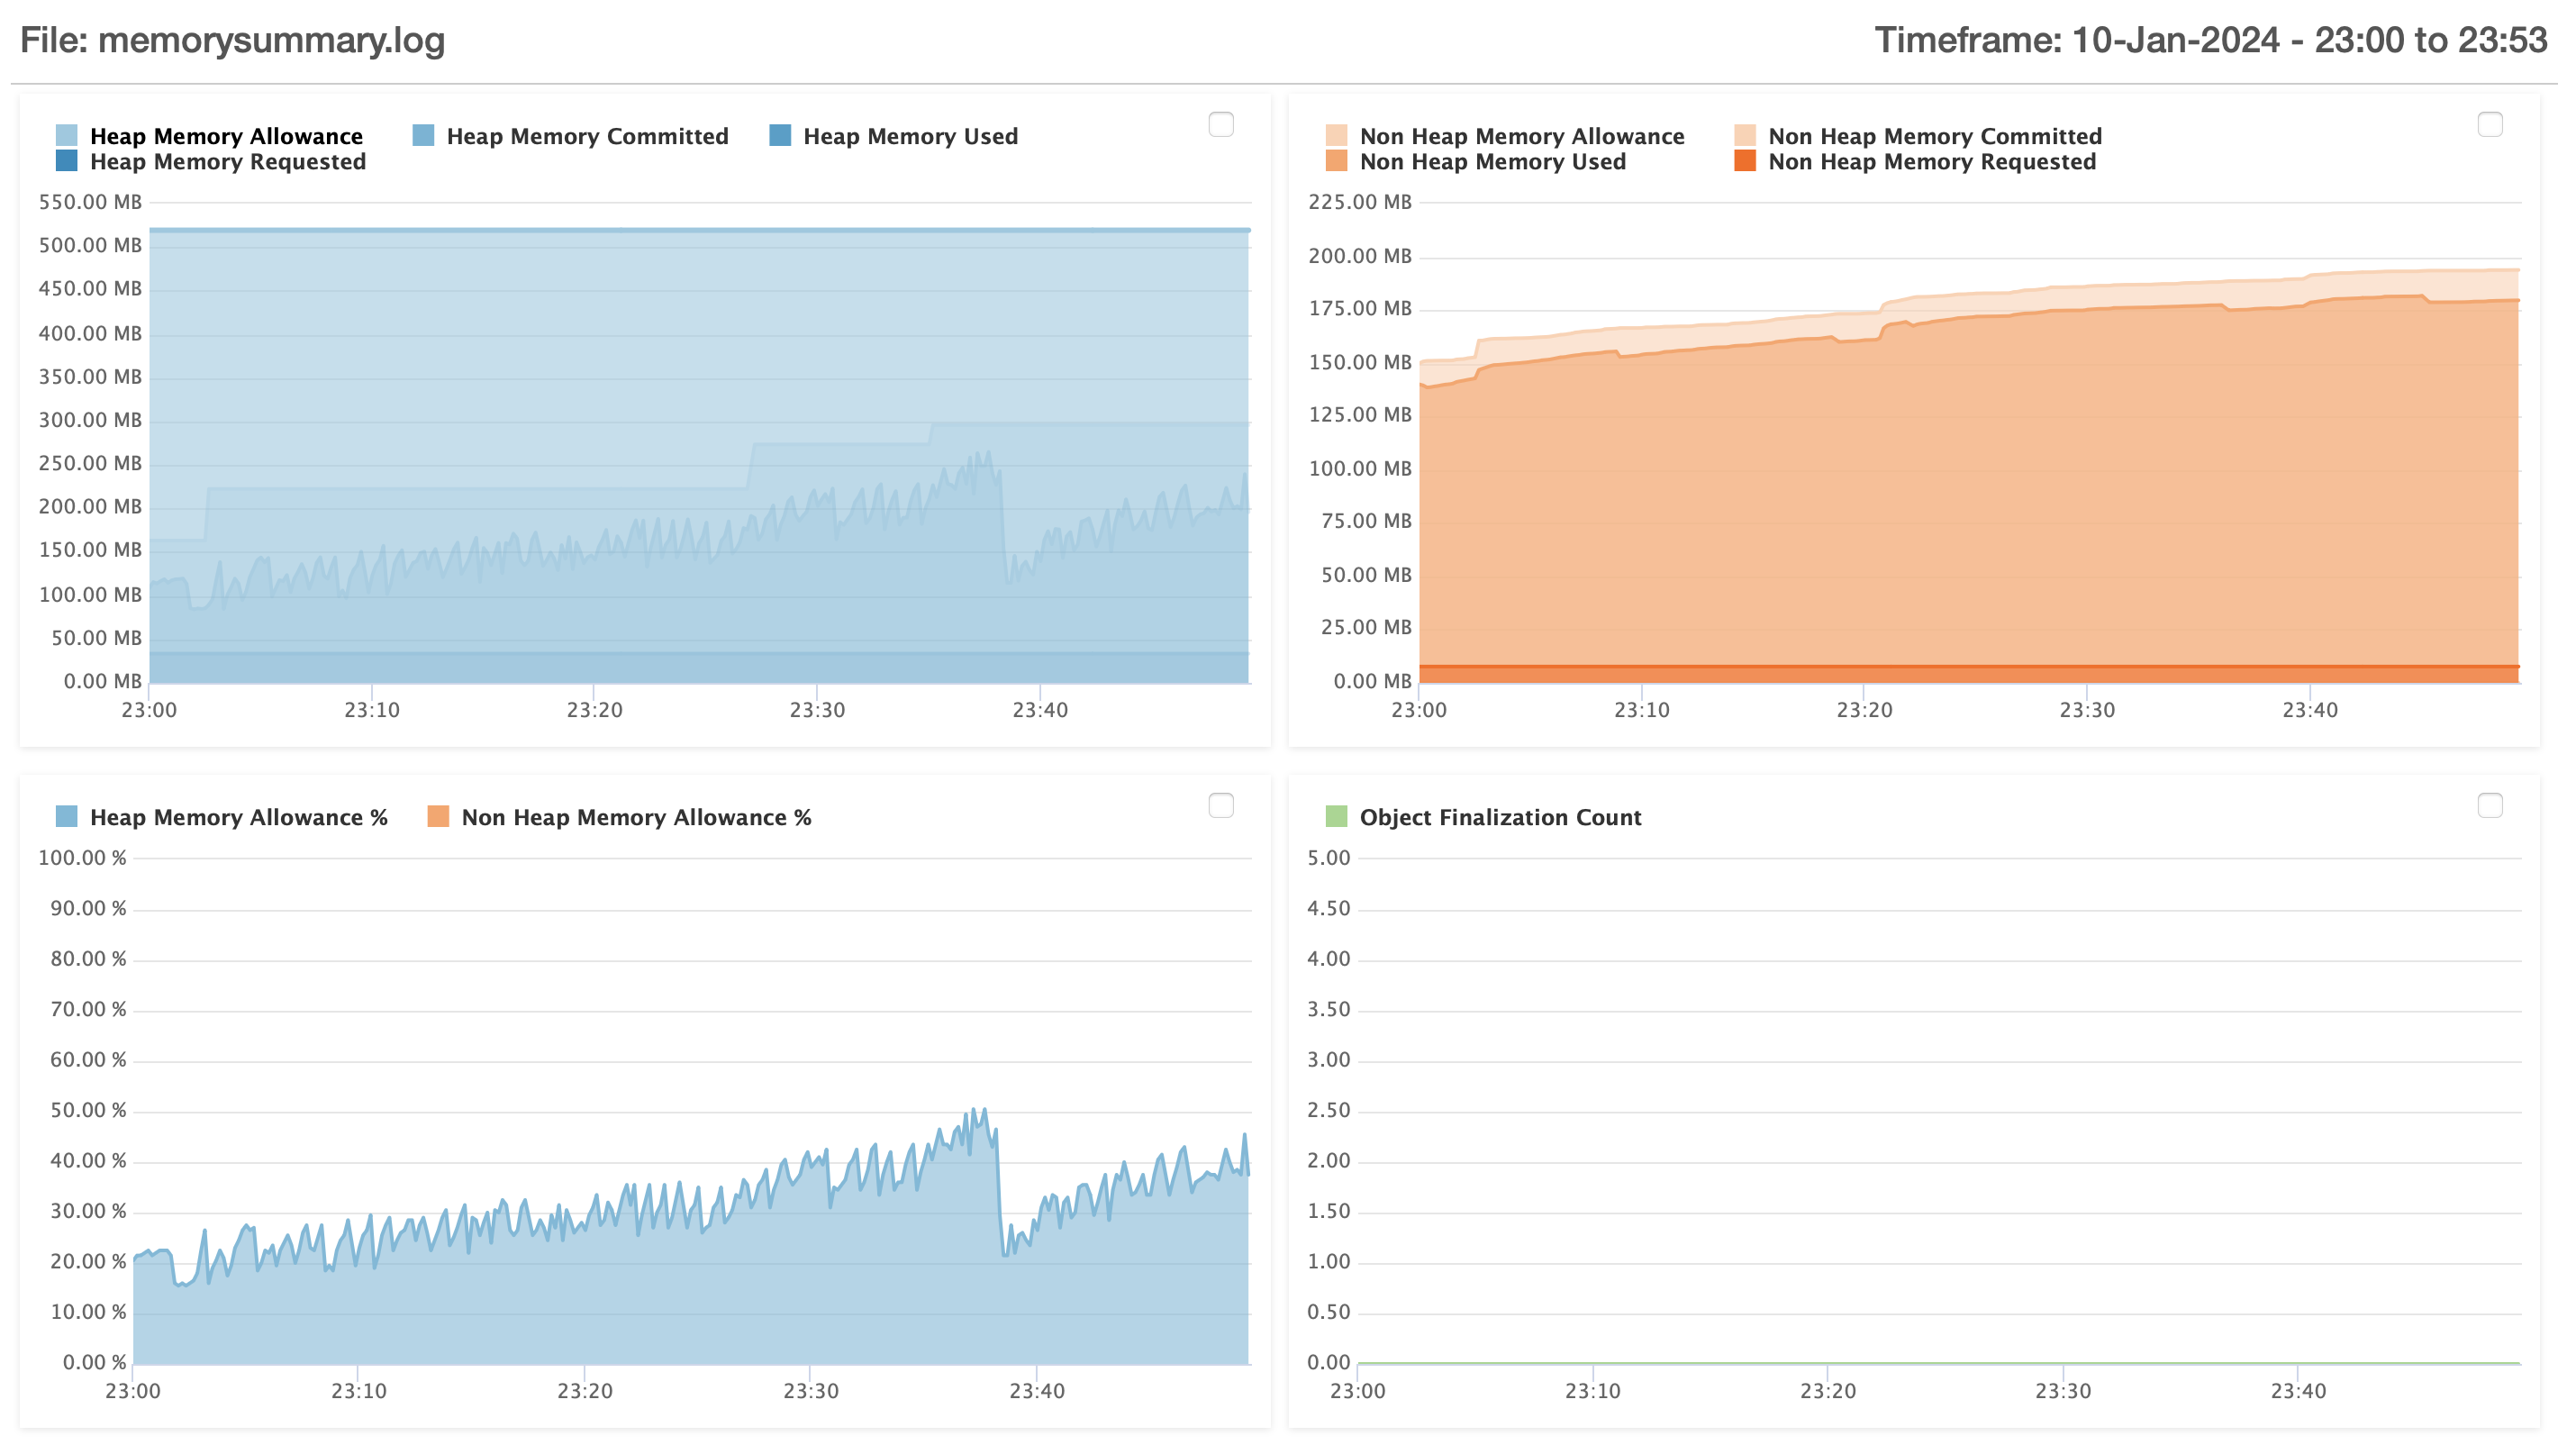
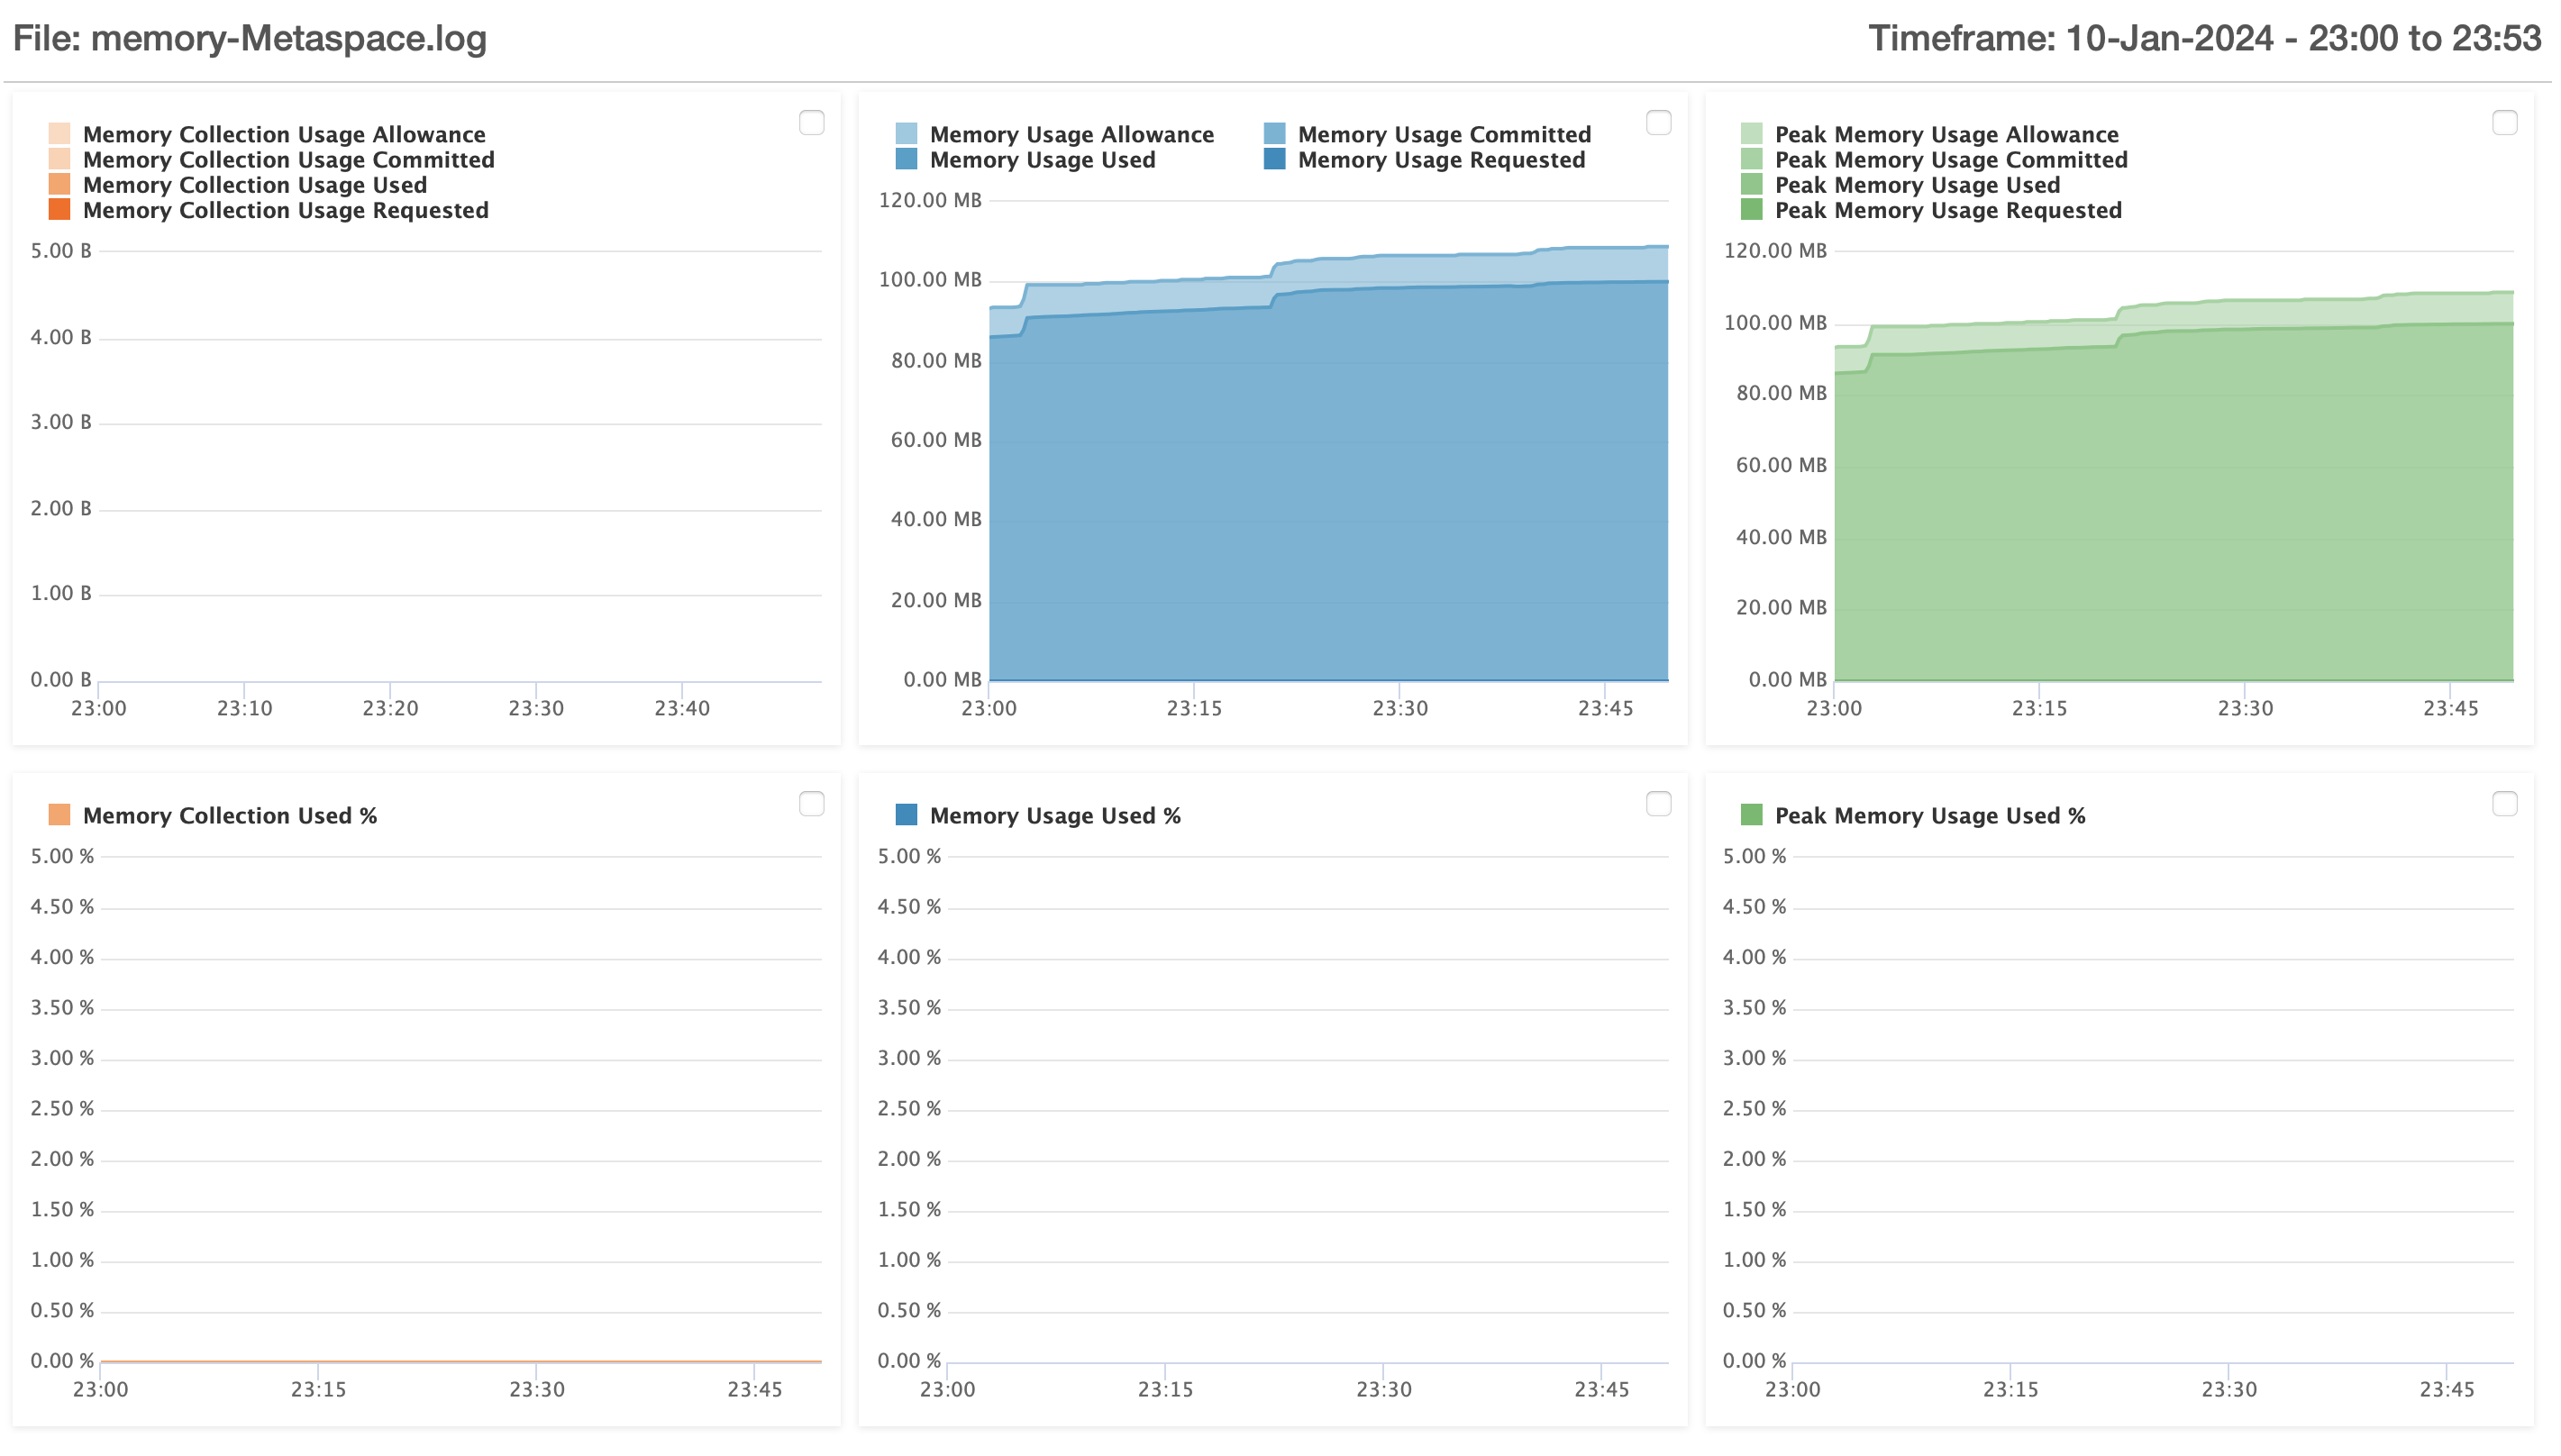
Here are some (hopefully) helpful illustrations from FusionReactor from today with about an hour of time under the server’s belt from its last restart.
Memory

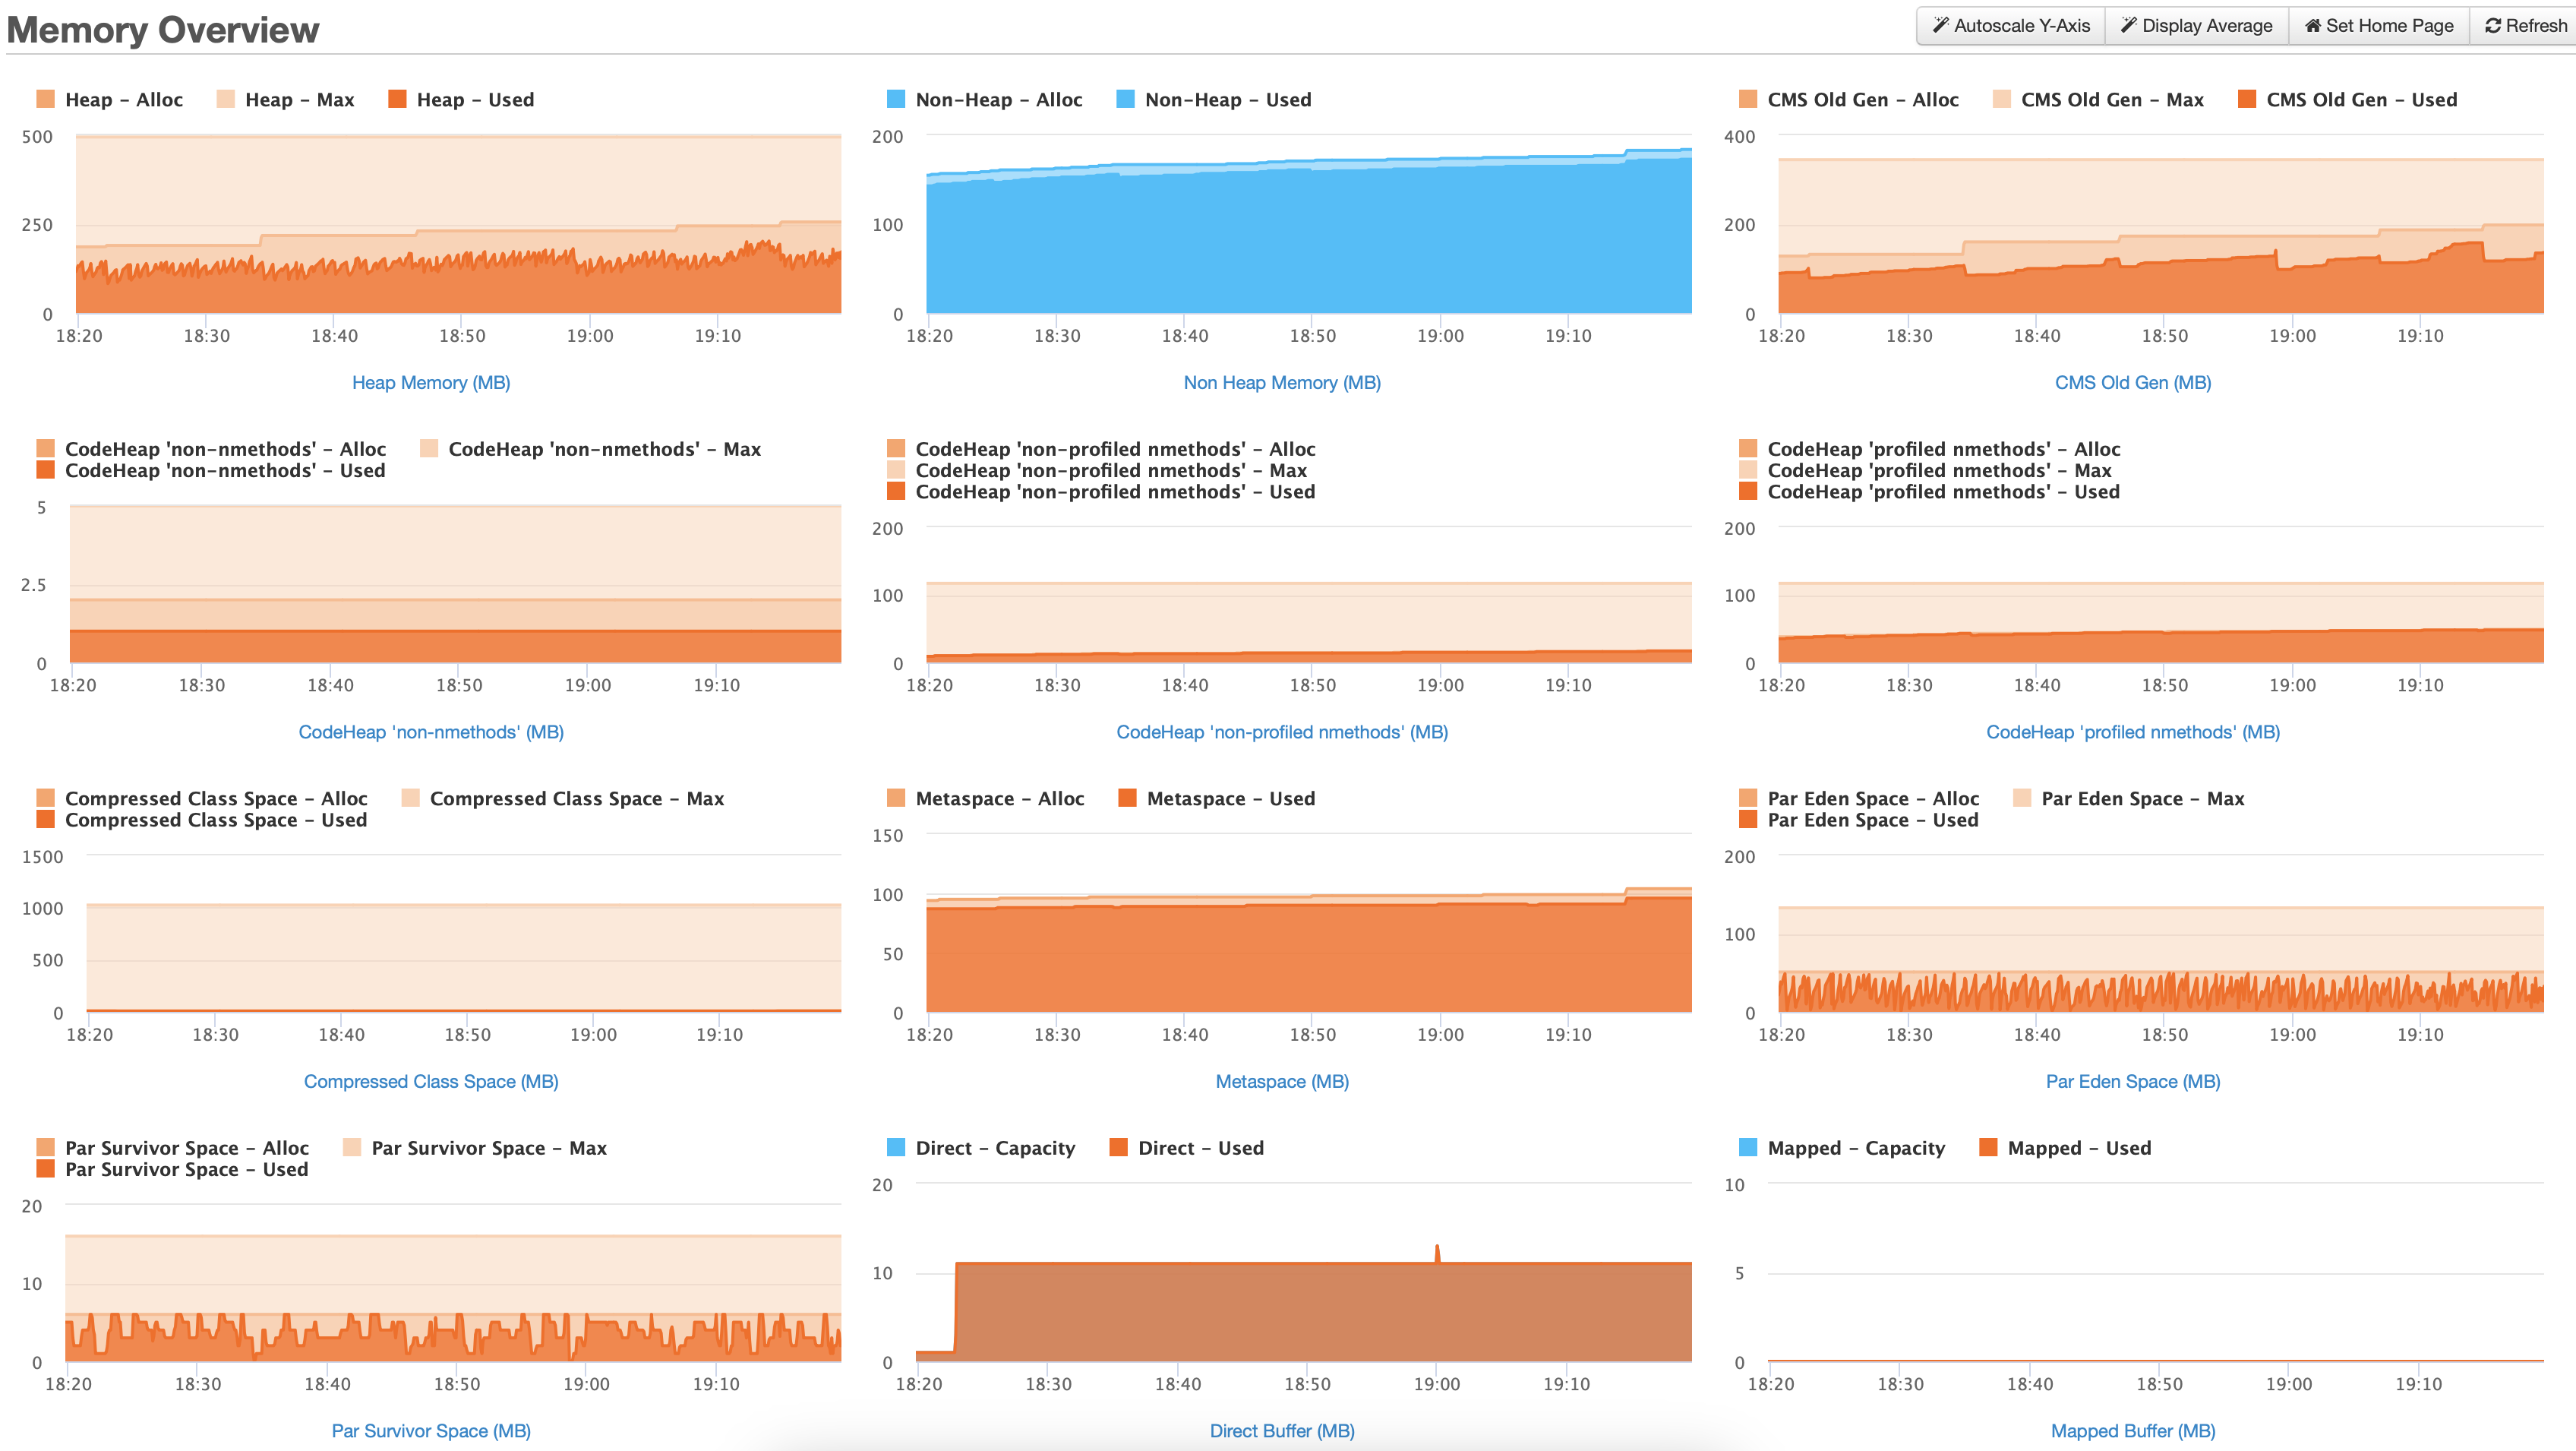
As you can see, we are in a death spiral. You can see the ever-increasing non heap memory usage, never, ever, ever to go down, literally ever, it will not reduce. Ever.

Class Loading


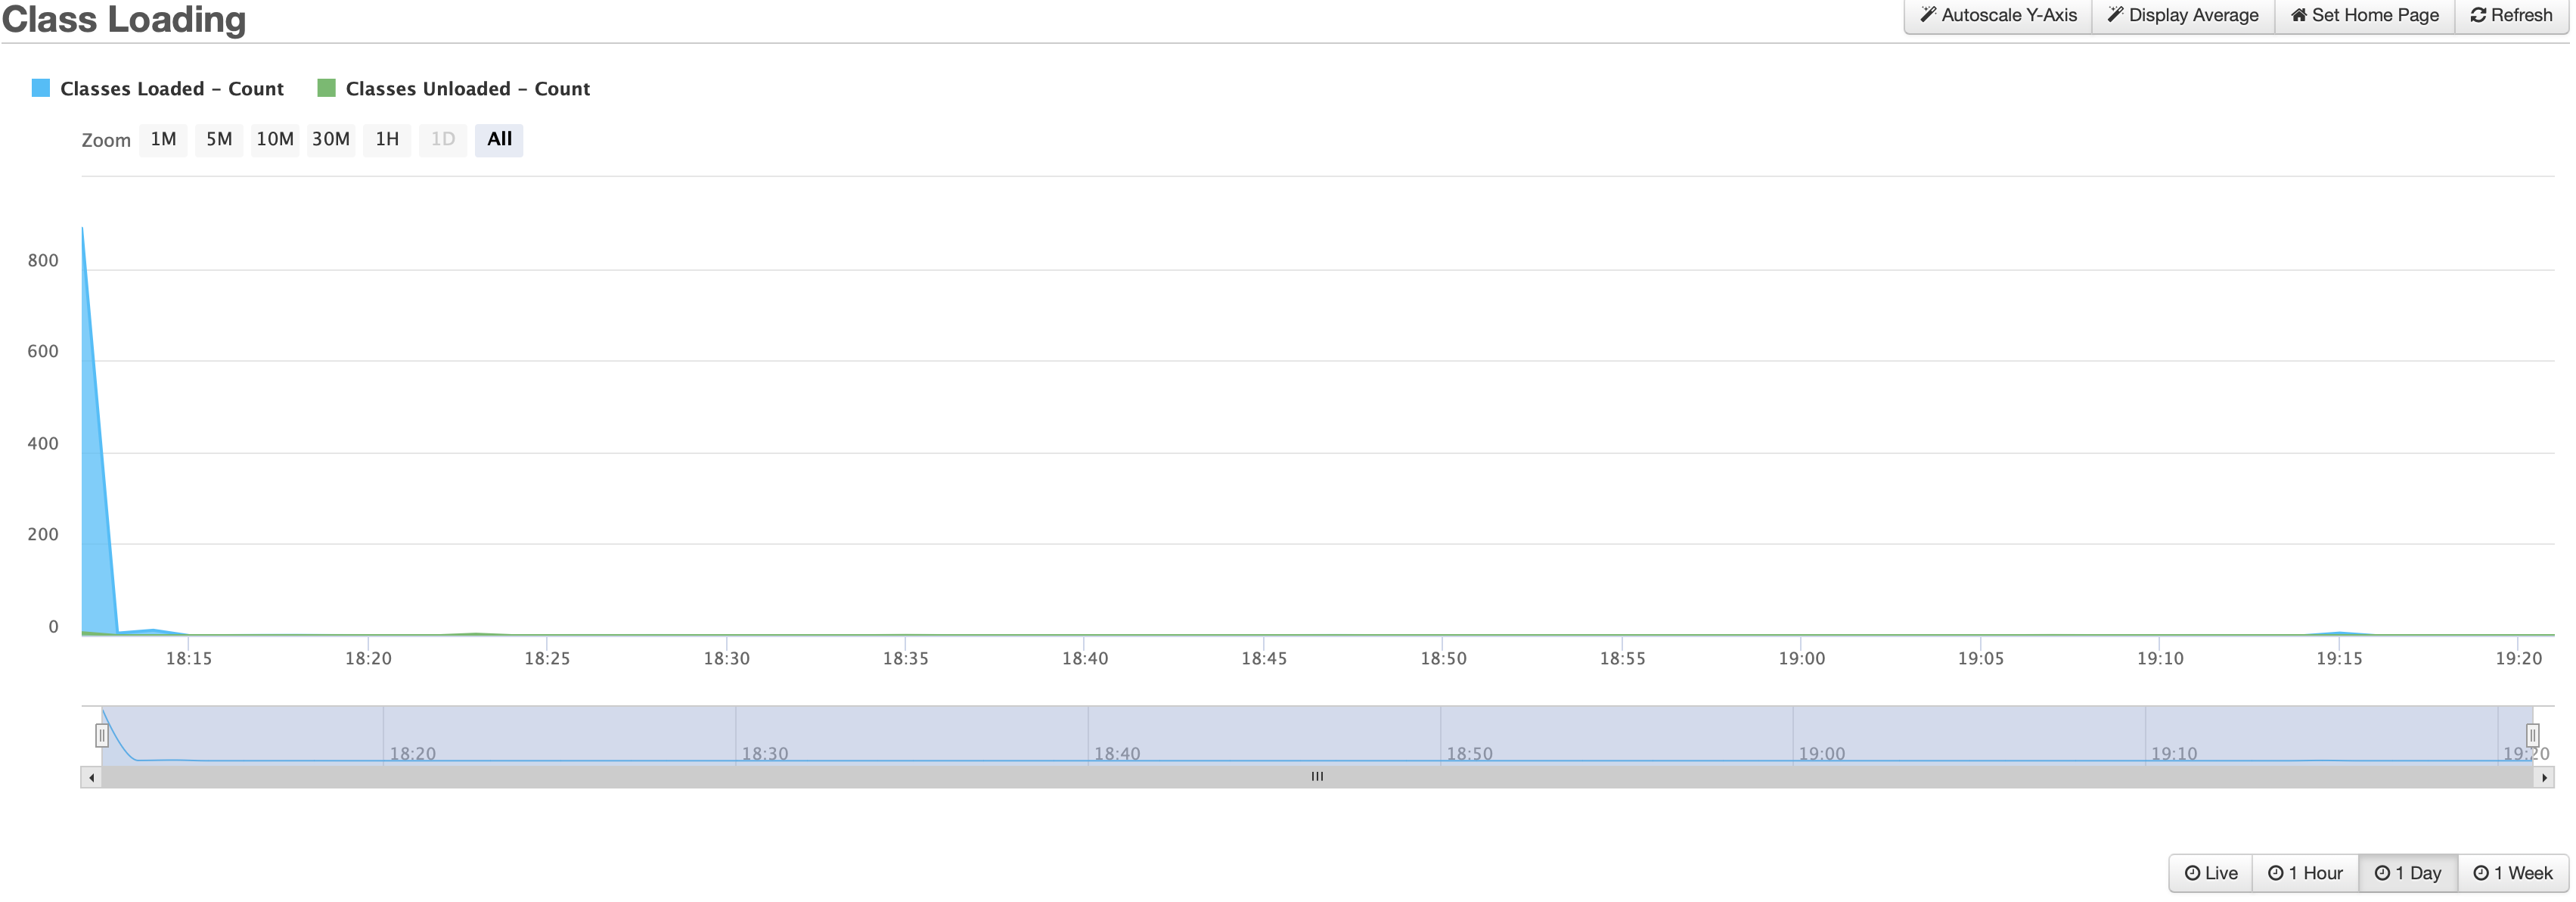
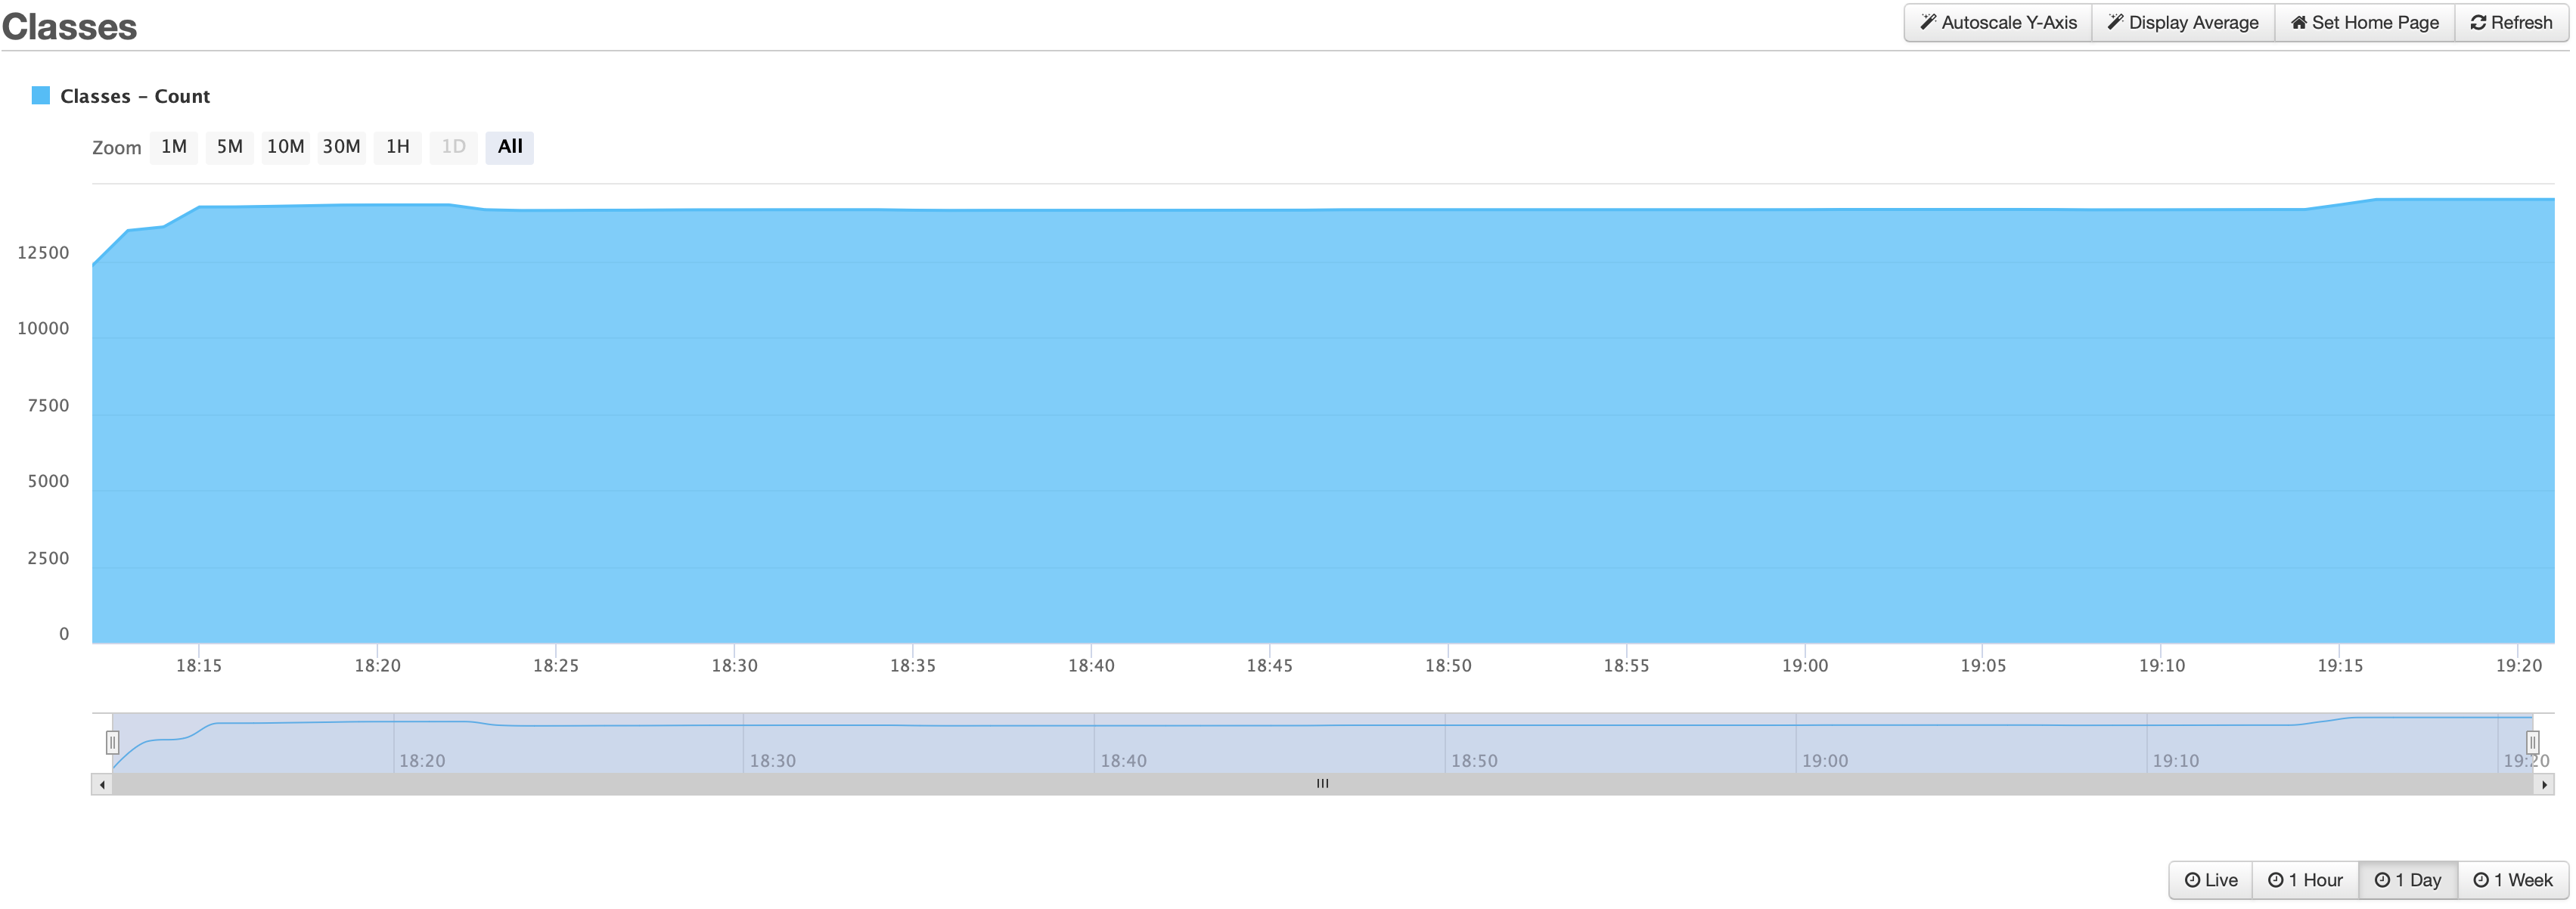
Here we see class loading and number of classes, which spike at launch and then rain mostly steady, usually increasing very slowly throughout the server’s short life on this earth. Some classes get unloaded, but just a handful, while hundreds more classes load regularly.

I have run heap dumps of the Lucee instance and used the Eclipse Memory Analyzer Tool to compare them and search for leaks – none are identified with this tool.

Past Lucee bugs

I have also, of course, looked at threads like this, and this, as well as the associated LDEV things here and here, which describe ever-increasing Memory heap usage and attempts to fix them. I haven’t seen movement in those threads for months, so … there you go, I guess.

Things I can not be sure of

  • The move from MySQL 5.7 to 8.0
    This I can not be sure of – whether there are changes to the Lucee interactions with the Datasources or if MySQL 8.0, itself, has some kind of issue. But … given the popularity of MySQL, I’d think this is unlikely.
  • Ubuntu 20.04 vs 18.04
    I mean, I guess it’s possible that this introduces some weird new memory management issues, but I’ve not seen anything clear on this in searching.

Things I have tried

  • Multiple server versions. I’ve tried Lucee 5.4.3.16 all the way through Lucee 6 – all have the same behavior.
  • Adjusting MySQL buffer pools. No change to Lucee’s non-heap behavior.
  • Pressing “Garbage Collection” in FusionReactor – results in no change to non-heap memory or loaded classes.
  • Examining the heap – not seeing any specific pages or operations that are being referenced, other than byte[], java.lang.string, java.util.HashMap$Node – nothing notable in these.
  • Pressing “Clear Page Pool Path” in server administrator – no change to memory usage or classes loaded.
  • Plenty of other stuff but this list could go on by hundreds of items.

What now?

This is the most comprehensive forum post I’ve ever written, probably, but I hope it can capture where I’m at, why I’m at a loss for explanation and how I’m unsure of where to proceed.

If anybody has any tips or ideas on how I can best approach investigating and fixing this, I’d be grateful. I will attempt to not be “defensive” of my code, but, I will again note that the code itself has literally gone totally unchanged and was totally problem-free before this server move. But I also recognize that some variable in this move could have triggered something in my code to make it basically completely problematic. Any diagnostic code to identify this would be useful.

And, I want to also add, I am a hobbyist at this. Much of the terminology and knowledge is very challenging for me, and I do not have resources to “hire a professional” or “call in a pro” or something like that. I also don’t want to move to a hosting service, as I need file system control for the image processing and other items.

TL;DR: My Lucee application worked flawlessly for years and now it is fundamentally unstable and unreliable. I could use help learning why and how to fix it.

2 Likes

My first observation is that nothing about those fr screenshot shows you to be in any way in a “death spiral”, at least not at the time shown. Indeed, I see nothing unusual about those screenshots: they look perfectly normal. But I realize you’re scrambling to resolve things, and perhaps under increasing pressure.

Instead, you want to look at such graphs (about memory but more important about overall lucee processing) at the time just before the outage, rather than “an hour in” (as you said this is) if all’s well then. And you can do that with fr’s metrics>archived metrics page. It’s not clear from your words: have you seen that? With it, you can look at how things were going BEFORE a Lucee (or CF) restart, which is a surprising delight for many to learn.

But it works based on is the assumption that fr’s logs from that prior run are indeed available. By default, FR keeps its logs for 30 days. But you mention being on lightsail. Maybe you’re losing them on those total restarts. If you go to the metrics>web metrics page, you’ll see a date and time picker, which should show fr’s logs starting each hour or on any lucee/cf restart. Can you see any times before your last crash/restart?

If not, then you’d want to figure out how on lightsail you can have it save logs elsewhere. To be clear, this archived metrics feature can only look at logs stored by fr in the zips it creates for these logs. We’d be looking for how we can tell it to store some files elsewhere. Fr let’s you point to that location on its logging>settings page.

Otherwise you’d have to look to FR Cloud instead, which you get for free with that fr trial, where the fr you implemented pushes it’s metrics and logs up to a cloud server the fr folks manage for you. It has an entirely different interface. Click the green cloud icon in the middle/right of the top bar of your current fr interface, to be taken there. This is not the place to elaborate on the differences in the ui and how to leverage it.

But take a look at what I’ve posed and let us know where things stand in your making any sense of that.

I get it: you just want to stop the madness. And you feel you’ve done nothing to cause it, nor can you seemingly find or offer anything to explain or resolve it. My money is on it being either a configuration issue, or something about your new deployment architecture, or perhaps due to new unexpected traffic. I’d not think it’s about your code, not necessary the minor lucee upgrade itself.

It’s not a fun position to be in, but it’s not unique. I help people in this sort of situation about daily (with cf or Lucee “hanging” or “crashing” for “no good reason”)–whether I do it in an online consulting session or here in the community. Either way, I try to help folks understand and use the diagnostics they have or to enable new ones if needed.

Some problems just aren’t easily solved in a forum thread. I get it that some don’t want to or can’t pay for help. If I offered the online consulting free to everyone who couldn’t or wouldn’t pay, I’d honestly not have time to help those who do, who keep me busy full-time. So helping this way, while not optimal, at least also helps others with the stomach to follow along.

Thank you, @carehart, very kindly for your response. To answer your question, yes I do have the logs from immediately prior crashes visible via the “Log Archive” function in Fusion Reactor. It does seem to be saving those. I’ve reviewed them and found no unusual activity, no spikes in requests, no long-running pages, no weird threats. Basically just any random page request and the server decides, “well, we’re done here,” seizes completely, invokes an oom-killer and ends all network activity. It could be any page. A random scheduled task, a request from a web visitor, anything. For fun, here is a screenshot of the resource.log file from just before a crash, mere moments ago:

In addition, here is memorysummary.log:

And memory-metaspace.log

It’s always like this. Just normal operations and then, “you’re done.”

You mentioned that my screenshots seemed pretty normal. I’d like to note that if you expanded the time scope to the full life cycle of the server, they’d look the same – just endless, ever-growing non-heap memory and metaspace graphs. No spikes, no big moments. Just endless, slow growth.

Perhaps I might return some questions:

  • Is it actually normal for classes to grow, endlessly?
  • Same for the non-heap memory – is it normal for it to grow and grow and grow forever, never reducing?

The reason I ask is that I’ve seen lots of talk about it actually being unusual for Lucee to accumulate open classes and ever-growing, never-shrinking non-heap memory. That’s why I’m pointing in out, here. What I don’t know is, “What would cause Lucee to perpetually grow non-heap memory, metaspace and leave classes open forever?” But, if this is not actually a problem … then maybe the question doesn’t matter? But, to me, it seems like a problem? Particularly since the system always performs this oom-killer action when this happens. So, to me, that says, “we’re out of memory.” Which … seems bad?

Well, your screenshot don’t show classloadiing constantly growing. Indeed, it went down at about 1823 in the graph in your first message.

But yes, steadily rising class counts are not that unusual. And to be clear, Gc’s should not be expected to make that count drop. I think you maybe over-focused on classes.

Now, let’s turn to metaspace, which is often the most significant portion of non-heap use. It, too, seems not to be growing wildly. But we’ve only got these graphs–and your assertion of what watching over time–to go on. FWIW, there IS an available maxmetaspacesize jvm arg that could impose a limit. I’m not sensing that’s the “solution” you need.

Again, let’s put it aside for now, as there’s ZERO indication of a metspace problem in these graphs which you say precede an outage, which looks to be about 23:50 per these latest SCREENSHOTS. Same with the heap graphs.

Instead, the ONLY thing that seems large here is the top right graph of the resource log graph, which is the cpu. You didn’t mention observing it (or anything about cpu in the previous messages here).

What’s MOST interesting is that it’s NOT cpu from lucee that jumps up at the end. That’s the dark yellow in that graph: the light yellow is TOTAL system cpu… and clearly something OTHER than lucee is the cause of that spiking. (And FR runs within the jvm with Lucee, so it’s not that.). This seems worth considering more.

I know you said this new box is better-configured than the previous one, and that it has lucee and nginx and mysql. Perhaps the problem is with them, and how THEY are configured. Perhaps mysql is stealing more memory than it did on your other box, and perhaps THAT is leading to high cpu with that as it tries to work in the limited 2gb all this is running on.

That’s just a total guess. It could be nginx. Heck, it could be that this box has some different anti-virus than the first box, or some other software.

Sadly, FR can’t help with this problem. It does at least offer in the ui a list of what processes are running (assuming the user running lucee can see them). That’s under the “system resources” button on lower left (offered with fr ultimate or this trial). But sadly it does not LOG that info, so it won’t help when this happens to you so suddenly. Similarly, FR does also track within there the total memory used on the box, but unlike the system cpu it does not log that info.

It seems you now need to explore instead what either linux or aws may offer you, to understand better what’s going on from an OS or system perspective.

Again, that’s my take given what you’ve shared. Someone else may see something I don’t, or may propose a better diagnostic approach than I have.

1 Like

I’ve got nothing helpful to offer here, but an observation that the initial Q is incredibly thorough, and Charlie’s feedback is excellent. I’m kinda going “wow, nice one guys”.

I wish more reqs for help & responses were that good in the CFML community.

5 Likes

Thank you, again, @carehart for your kind response. Allow me perhaps to comment and pose some questions:

I didn’t say it was growing “wildly,” I’m saying that it grows steadily and without end on a server that, like most computers, has resource limitations, namely RAM. This is where I wonder why this is not considered some kind of issue – because it appears like Lucee is just throwing more and more and more into that metaspace, which to me seems, you know, unsustainable. Like, the metaspace has a hard limitation: the system memory. And if you exceed it, you get an out of memory issue. And – if Lucee just keeps making it bigger and bigger – isn’t that a problem? I’m not trying to be stubborn here – genuinely – why do you think an ever-increasing metaspace is not the problem that it looks like, to me? And why would Lucee do this?

Again: there is no “spike” event to point to here. The reason I think this metaspace thing is so critical, from my point of view, is because it appears to be a runaway memory train, albeit a very, very slow-motion one. I really would like to learn more about why you don’t think this could be a problem.

I guess I’m wondering why you think this? That’s what I’m getting at, here.

Well, that may be interesting in this case, but that’s not common across the various crashes I’ve experienced. Some have a small CPU bump, others don’t. The server, at that moment, was executing a scheduled task which has a <cfexecute> tag on it to an aws s3 sync operation, which often does consume a fair amount of CPU time, and that’s normal. But that task runs routinely, every 12 minutes or so, without issue, and, crucially, has no close temporal association with other crash events.

Indeed, the increase to two vCPUs should actually help with this particular task!

This may be possible, and I will examine it further, though it is very hard to tell. The move from MySQL 5.7 to 8.0 does involve somewhat of an increase in memory consumption, from what I can see online. But, again, this is not a mega-server, the level of operations hasn’t changed that much. I did add this line to the /etc/mysql/mysql.d.conf/mysqld.conf file:

innodb_buffer_pool_size=134217728

Which is 128MB, not much. It doesn’t seem to have much effect, anyway.

Thank you again for taking time to respond.

Again, the cpu spike is NOT in Lucee, so the cf scheduled task you refer to is not at issue. More specifically, there’s NO indication in the resource log graph of any long running request. On the right of that graph, it shows the request Runtime to be barely more than the rest of the graph. (You may want to look into why most requests show taking about 5 seconds, but that seems unrelated to this sudden hangup.)

And as for whether this specific set of graphs for this specific sudden hangup is representative of others, only you can determine and confirm. Please do, as otherwise for now I stand by all I said.

In particular, show us the crazy large metaspace value you’re so concerned about. Ever-increasing is NOT alone a cause for concern. And again, if you want to enforce a limit, add the maxmetaspacesize arg. That will likely just impose a new oom error within the jvm, but maybe instead it will force the jvm to try to manage that space differently than when it feels it’s free to grow. And sure, if it grows far larger than ever before for the same traffic and config and such, it’s potentially an issue. Just not in this set of logs/graphs.

And I realize this has been your concern from weeks ago. Please, though, let’s put it aside while we focus on what that outage DID present in those graphs. More than that, please confirm what the most recent PRIOR outages shows, whether the same or different.

And yes, 100%, the high non-lucee cpu spike just before the crash is of first importance to understand about this outage. Please fight the urge to bring a presumption of some prior experience from other outages being necessarily what is or is not going on here. Sometimes one can have DIFFERENT problems, and solving each is the key. And sure, sometimes another will be lurking behind it–which you HAD seen before. Perhaps when we resolve this or look at your prior outages, you’ll find evidence of what you’ve seen in the past.

For now, let’s just follow the diagnostics where they may lead us.

Finally, as for whether the “level of operations” has or hasn’t changed, beware also of presuming that the current traffic is the same as the past. You can actually check what requests have been coming in using FR. Look at its Requests>history page (the 100 most recent requests) or the request.log in that archived metrics (tracking EVERY lucee request), to make sure the current traffic is indeed what you expect.

You may find something different from what you’d have expected in the old server. (I realize you didn’t have fr on that server to compare things carefully. I just mean what you may expect generally about whether the requests shown seem typical to you.)

Thanks, Adam, for the kind regards. I love helping solve problems, though it can indeed be quite challenging at times. What doesn’t kill us makes us stronger, right? :slight_smile: And I say that for all our sakes, those who ask, those who answer, and those who might learn from following along.

And like other folks, contributing here (publicly, for any to benefit) is what I can do for the community, where I can’t help much with the core engine and such.

I’d like to set aside the crash issue for just one moment because I think we’re just completely misaligned on something here:

To be clear, I’ve never said there is a “crazy large metaspace value” that concerns me. No singular “value” concerns me. What I have said is that I am concerned that an ever-increasing, apparently never-ending increase in metaspace seems (very obviously, to me) like it is unsustainable. This seems facially, transparently, an issue. You disagree.

Please – I don’t want to sound confrontational or argumentative, but … can you please explain to me why it’s ok for the metaspace to just grow, grow, grow, grow, grow, grow, grow for eternity and never shrink? Never reduce? You’ve told me this isn’t an issue, several times. I’d like to understand why you think that.

I’ve never had to worry about Java memory usage before, so – really – I do not know. All I can see is a metaspace memory value that increases perpetually and without ever reducing, and then a server that experiences an OOM event. I don’t think it’s unfair to assume that a constantly growing, never-shrinking metaspace (eating up memory) and OOM errors (no more memory left) are related. Honestly. I don’t think it’s unfair to think that. Why shouldn’t I think that’s an issue?

And – I don’t understand anything about the way Lucee chooses to use memory. I don’t know what goes into the metaspace. I don’t know if there even is a way to reduce it!

I have sleep operations on certain scheduled task pages to prevent exceeding API call rate limits, it’s not a big deal.

To note: this CPU usage occurs when a scheduled .cfm task does a <cfexecute> call to the AWS CLI, which performs an S3 sync operation. This causes a new process, running as the AWS CLI (not Lucee) to appear in htop, perform the sync operation, and then close. It uses little memory (maybe 2 percent), but a decent amount of CPU. That is why there is a spike in non-Lucee CPU.

I’d like to also just note that I’ve compared request logs between old and new servers and I can tell you, with 100 percent complete and total certainty and zero ambiguity: there is no increase in traffic between the two servers. It is the same level of traffic. If anything, there is less, since I’m more focused on fixing this two-month-long problem rather than actually using the application.

Thank you for your help, again, as these are complicated topics. Please understand that I’ve spent hours and hours and hours reading literally your own writings and posts; on your site, in forums, and so on. I appreciate the insight you’ve offered, and have already proactively attempted many of the suggestions you’ve made in other places. So, when I say that the application is not getting increased traffic, please – believe me. It’s not. I promise.

Good afternoon. I’ve been monitoring my server for a while now, and have been keeping an eye on crash events and non-crash events. So far I’ve not found many correlations to any particular events, or CPU spikes. Sometimes the CPU spikes are there, sometimes they are not. There remain few clues as to what “triggers” the Out-Of-Memory server crashes, but instead it seems that, as the server’s age progresses, it something just randomly pushes it over the edge. So – still inconclusive there.

I’m still wondering if there might be any explanation for why the non-heap memory and metaspace might be on an ever-increasing trajectory, and why, as @carehart mentioned, this would not be considered a problem.

There is no unexpected increase in traffic or any unusual requests. It’s just a random moment, and the server says, “we’re done.”

So the only thing I’m left to ponder is the ever-increasing metaspace and non-heap space, which continue their ceaseless march upward throughout the life of the server.

Why might metaspace and non-heap space always increase? Is this considered normal? Or symptoms of an underlying issue?

2 Likes