Good to hear the confirmation of the 1g. Bummer to hear that even 2g doesn’t help. But since downgrading to the same Lucee version that worked didn’t help, that seems surely to suggest that what’s changed is not about Lucee, per se. (Can you confirm that is indeed the case, that downgrading to what you ran before did not help?)
As for my presentation not helping, note that it’s built upon others which I referred to as it went. I can’t know if you’re saying you already knew what those discussed. I also can’t know what you do and don’t know about fr. I get the sense you may feel generally that it’s not able to help, but I’m confident that it can and usually is.
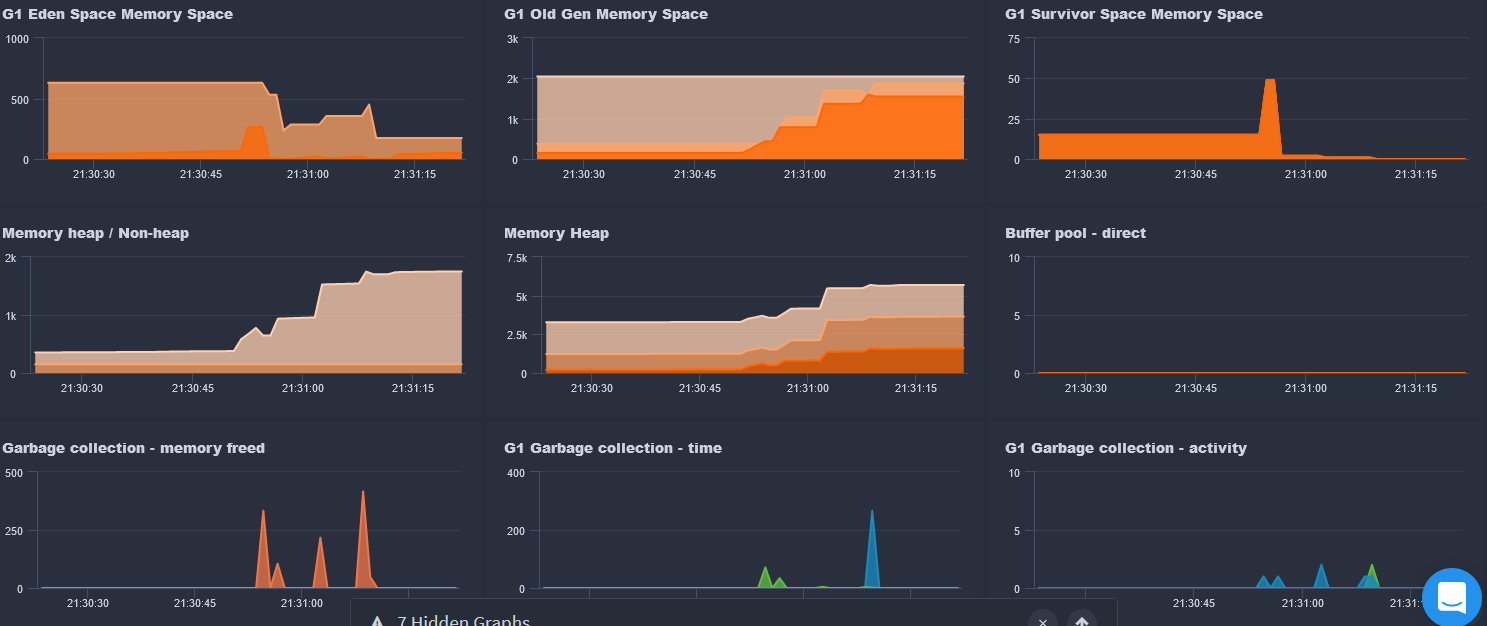
For instance, have you confirmed which space in the heap is rising? And are you getting and outofmemory error, in any lucee or tomcat log? Or do you see it in your app or fr?
And are you saying heap goes up as you run requests repeatedly? And are you perhaps trying to do a Gc from within fr, between requests, to see if the heap is not going down then? I’m that case, something is holding memory.
And did you confirm if it’s something like sessions going up, if your app has them enabled? If you’re running a load test tool, note that if that tool doesn’t send back the session cookies, then each request creates a new session. That’s an example of where perhaps a change about your load test (then and now) is more to blame than Lucee itself.
I’ll add also that that the talk was, as I said, from 2017. And while I said that what it offered is essentially unchanged, there ARE some new things in FR that may help more on this. First I’d mentioned in that video that the memory profiling was then coming soon. That may help (especially its ability to compare a memory profile at one point in time to another), though it’s available only in the fr ultimate edition (or like any such ultimate feature its also in the trial or developer edition).
Then again, you say that ‘looking at the “profile” of the error in FR is unhelpful for me’. To be clear, that profile you now refer to would not be the memory profile I just spoke of. Indeed, there’s no “profile of errors” feature in fr. So I wonder first if you may mean the “event snapshot”. That too is new, but it helps more with app errors rather than memory errors.
Or perhaps you refer here to the available “profile” of a request, available and offered (in the ultimate edition) for any request that exceeds 3 seconds. To be clear, I did not in my talk or above suggest that the request profiling feature would help with memory problems (though I’m not saying it can’t help, indirectly.)
FR also added (some releases back) a tracking of the amount of “allocated memory” (heap) per request. That can seem fabulous to some, and it may help you. It’s tracked both within each request’s details AND as an available requests>by memory list. One thing I’d warn of is that is indeed showing the total heap ALLOCATED over the life of that request, not the MAX mem used at any one time during the request. As such, you may see a request shown with a value here of a few gigs–even when your heap max was only 1g! Do I mean to suggest that new memory tracking feature is not valuable? No, but it tends to confuse people, who think it must be mistaken.
I could also argue that with an app allocating such very large memory–even exceeding the heap–but not FAILING, that could be seen as a sign of the jvm doing its job: it IS doing GCs, clearly, which should help keep from running out of memory. Still, someone may argue (rightly) that one may want to question what is causing the request/their code or perhaps the nature of requests to lead to large memory allocation.
Again, that feature was new so I did not cover it in my talk. I’ll add a comment on the video at youtube to list a few such other things like the above, as additional tools in fr to help with memory troubleshooting. And it’s indeed time for me to reprise/expand/revise that talk.
Finally, I just commented about how if requests are COMPLETING and heap is being gc’ed, that’s good news. But you may well find that some request or requests are running AT THE TIME you run out of heap, and Lucee (or ACF) crashes. Here, @Phillyun was lamenting how the fact that FR dies with the cfml engine diminishes the value of FR. But that’s not as obvious as it may seem: besides the post crash troubleshooting video I referred to in reply to him, where I highlight the value of the FR CP email alerts (showing what requests were running at the time of trouble), I’ll also note that I did yet another talk on processing the fr logs with excel (or any spreadsheet tool). I referred to it in that memory talk also.
In that log processing video, I show a technique for finding what request/s WERE running at the crash, because the fr request log tracks BOTH the start AND end of a request (even most web servers only track the END of a request). As such, my technique shows using that info to find what requests were running at the crash, which has helped many (and I show it about monthly in my consulting). It’s at 47:30 for a few mins, here:
Hope that or something here may help. I’m sure it’s frustrating. You just want the problem solved. You may even want the lucee folks to own there’s a bug, but even then you have to give them more to go on. Zack’s trying to get that with you. I just approach things more from a diagnostic approach.
It may seem tedious, especially for those not familiar with the tools and techniques. I give away all the info to help folks wanting to do that for themselves, or again I can help folks via direct remote consulting. And I’ll repeat that if you don’t find the time valuable, you won’t pay for it–and we could of course stop as soon as you feel we’re not going to get nowhere. It’s rare that I can’t find and solve such issues.
I just find that trying to solve a knotty problem like yours via a forum as this is like playing battleship, for those old enough to get the board game reference.