Lucee Java Heap Space error on script after Lucee reinstallation

I have a very laborious script that worked fine for months on Lucee 5.3.8.189. Would take about 50 seconds to process each time.

To make it work initially, using the most recent Lucee version (forget which) caused the same memory error I’m getting now. I tried 5.3.8.189 and the script miraculously worked.

I recently (for unrelated reasons) uninstalled Lucee completely and reinstalled Lucee (5.3.9.141) and now I’m getting a Java Heap Space error after about 15 seconds running this big script.

I downgraded back to 5.3.8.189 and I’m still getting the same memory error as I did months ago, even though downgrading to 5.3.8.189 solved the memory issue previously. I’ve tried various other Lucee versions with no luck. I’ve also updated to JDK 18. I have the Tomcat mempool settings the same as previous which is 512/1024MB.

Previously when it was working, I hadn’t made any java/tomcat configuration changes to make the script work. Environment is Windows 10, IIS 10.

I’m really not well-versed in Tomcat/Java/Lucee technicals to know how to troubleshoot this. Any ideas what could be causing this issue?

Java 18 isn’t fully supported yet, [LDEV-3807] - Lucee

What’s your script doing, it’s doing some batch processing right?

I’d guess the data you are processing varies, are you sometimes fetching enormous queries?

It’s doing batch processing, yes. Looping through large queries hundreds of times to experiment with financial data.
Though I am currently using Java 18, upgrading to it from the packaged Java version was an experiment to get it to not have these memory problems. It didn’t work just the same with the packaged version of Java, so I don’t think that’s the problem my situation.
It’s just odd to me that i had this exact problem before and downgrading to 5.3.8.189 fixed the problem, now downgrading isn’t solving the problem anymore, so it must be something else but I have no idea how to tackle this.

I’ve now done a full removal of lucee/java/apache and reinstalled Lucee by Windows Installer:

  • Lucee 5.3.8.189
  • Java 11.0.11
  • Tomcat 9.0.46
    Same Heap Space error as described in original post.

@thequeue, bummer to hear of your challenges. First are you confirming that heap size you report is indicated in the lucee admin? People sometimes set it in config but the wrong place, so they’re at the pre-installed default and don’t even think to see what the admin reports.

Second, as you may know a tool like FusionReactor can really help in cases like yours, giving you vital diagnostics to assess–versus the understandable temptation to “try various things” in the hopes to make the problem go away.

My experience is rather that even the most mysterious, troublesome issues sometimes become trivial to solve once you have the right diagnostics in place to know the real problem. (The memory error will have a root cause: finding that is the key, and it is often not at all what people presume.)

FR has a free 14-day trial. And I have a playlist of videos (about 12 hours, for those who really want to learn it), but just the most recent few would help folks get started to leverage it most effectively. And one of them is specifically on troubleshooting memory problems. :slight_smile:

Finally, for those who can’t or prefer not to dig into such things on their own, I’m available on a remote consulting basis, for as little as 15 mins. And it is possible we could find and fix your issue that quickly. I help people this way daily. Even if not done that quickly, I have a satisfaction guarantee so you’d not pay for any time you didn’t value. See the site for my rates, approach, online calendar (for work during weekdays, am on central time) as well as contact info to reach me even for work in the evenings or over the weekend.

As for continuing here, I’m happy to help though afraid it would be hard to guide you further without more info–such as what FR could show, but again let’s start with my first question. Then we’ll see what I or others may be able to help you with.

how big are these queries? Lucee will crash if it doesn’t have enough memory to hold all you queries in memory. Are you clearing the queries after you use them, i.e. q_invoices = "":

as i said before, the data you are processing is always changing, so I doubt it’s actually anything to do with Lucee or java versions, it’s just you probably are returning an enormous query dataset which exceeds the available memory. are you selecting more columns than you need?

Try putting some debugging into your code, log out the memory usage and query size progressively to find at what point you run out of memory.

another option is try using the lazy query approach, which doesn’t read the whole query into memory

I don’t mean to hijack with a “me too” … We’ve had a similar recent issue.
Thankfully Production is still working fine for us where our test system has gone sideways for no obvious reason. The change is the Lucee version.

Similar here (multiple laborious scripts, memory doesn’t seem to free up when the task finishes).
We just tried a downgrade to see if it performs better again, an updated version is the only difference for us. Downgrade = no joy.

Unfortunately when this happens, FR goes with it. What help does it provide when I cannot connect, only to see no threads running when the server is restarted? (Where should we be looking since no threads will be running when the service comes back up? )

I’m sorry, say wha-?!
:astonished: :exploding_head:
We explicitly do this for PII (passwords, etc) but when a thread finishes, I expect the variables (data and memory) to go with the thread completion (or death).

  • Will try this and report back (tomorrow)

Usually yeah, but it depends on the code in thread and if the variables are properly scoped

for example, I’d suggest checking what’s in the cfthread scope, as that persists until after the request (and all threads, even if the request has ended) has finished?

Another option is, you can always take a java heap dump, either

then you can open the heap dump in Eclipse Memory Analyzer Open Source Project | The Eclipse Foundation and see what the largest objects in memory are

I’ll start with this suggestion as this is golden … a long long time ago in a galaxy like yours, we threaded these loops in order to reduce the processing time needed.

  • Every thread does it’s work and returns a status.
  • We Join at the end, gather up those thread results, report/log then exit.
  • It’s been plugging away for months / years with no large change in the amount of data

I’ll focus efforts on the large threaded tasks. You mention threads and I’m realizing variables passed into a thread does a deep copy (IIRC), so we may be inflicting extra undue harm on ourselves here if that memory isn’t being freed when the thread completes.

1 Like
  • The queries are about 12,000 rows with ~30 columns.
  • There’s no unnecessary data being queried
  • Normally the script loops through the same query 250 times. Previously, I could loop 1000+ times without memory issues. I’m unable to loop through even 50 times now without running out of memory.
  • At the start of the request, the 12k query is obtained from MySQL and is cached with createTimeSpan(0,1,0,0). The data being analyzed is static.
  • The script doesn’t use any tags.

Thanks for the advice.

I had previously tried debugging with FusionReactor the last time I had this trouble, but I wasn’t able to find any useful information because my knowledge of the inner-workings of Java etc. is very limited.
At that point I was trying everything and the only thing that worked was downgrading the Lucee version.

Ok, are you able to create a reduced test case which demonstrates the problem?

Typo… I meant to say that it doesn’t use any cfthread tags.
I’m currently trying some debugging with getMemoryUsage().
Since there’s no obvious answer it seems, I’ll dig around some more and return if I find anything noteable.
Thanks for the help!

Troy/@Phillyun, I address this common misconception with the first video you’ll see (currently) in my playlist, which is “Troubleshooting with FR, part 4: Post-crash troubleshooting”. It was last of a series. In the first few mins I offer an overview of what the talk will cover, and then in another couple mins I recap the first 3 in the series for context.

I really think you (and really anyone using FR) may be surprised to discover the many ways it can indeed be used even AFTER your instance has restarted (which is all the more valuable for those using ephemeral/cattle instances).

But to be clear, and as I allude to in that video, FR can of course ALSO provide value in understanding why a crash situation may be building up. I cover those in the earlier parts as well as several other videos in the playlist. It can be a lot for folks to take in or remember in the heat of the moment. I use it with people daily, and I offer pretty much all my experience with it in those videos.

Anyone wanting to solve problems and who has not or even HAS used FR would likely come away with many valuable insights to help themselves use it to solve most of their cf/lucee performance problems.

If it needs to be said, you don’t hear anyone talk about the videos because they’re not promoted in any way, so most are simply unaware of them. They were done as a series offered by the FR folks on their site, and they and I shared word of them then, then they posted them on YouTube, but we’ve not done any subsequent promotion of the recordings.

And yes, that series is from 2019, but I just rewatched that one I recommended here, and everything I said still applies to even the latest FR (or Lucee or ACF) versions, as well as even older ones. (I was confident that was so, but I was watching just to see if it really would be suited to stand alone in reply to the concern you raised, and I really think it does. I’m always open to feedback.)

Again, for those who don’t have the time or inclination to watch those or to do the diagnostic digging and dot-connecting themselves, I can help, often very quickly. It’s what I do daily, for a couple hundred clients per year. To be clear, I help out amply for free in the community via this and other forums, but some problems just can’t be solved readily via back and forth here. Good to see Zack and others trying, as will I where I think I can help.

2 Likes

Here again, I understand that lament. I would counter that by far most of what I show people about using FR to help them has nothing specific to do with Java, and virtually never about its “inner workings”. There are indeed some aspects of using it that relate to Java, but again I try to help people see how easily those aspects can be seen for what little they may need understand about the Java, really, to solve their problem.

As for your current trouble, you did say that this time downgrading Lucee has NOT helped, right? That’s why I pressed with this suggestion that FR (or other APM or diagnostic tools) could help, especially if traditional debugging techniques, tweaks, or analysis are not getting you to the solution.

Also, @thequeue, can you please help us by replying to what I’d asked originally, “First are you confirming that [1g] heap size you report is indicated in the lucee admin? People sometimes set it in config but the wrong place, so they’re at the pre-installed default and don’t even think to see what the admin reports.

I actually couldnt find where this is listed in the Admin console. I set the memory values in the Tomcat Service Control UI in windows in the Java tab. “Initial memory pool” and “Maximum memory pool”.
That would be great if I simply did t set these values correctly. Please advise.

See the overview page of the Admin:

Maybe I’m blind but in the documentation posted above, the only references to heap space are for charts with a percentage y-axis. I’m not seeing a place to view values for init and max memory usage.

1 Like

Sorry, I will explain the confusion regarding the admin graphs at the end of this post. For now, let me move on to the original goal, confirming if Lucee is using the max heap that you expect it to be. Fortunately there are a few other ways you can find that.

And if you confirm it is indeed what you expected, I have another more specific suggestion about FR for you, about really finding what’s USING heap.

1. Finding the heap amount for Lucee

First, the actual heap value set can be found in the Lucee/Tomcat logs. See either the catalina or lucee-stderr log, as may be found in your lucee\tomcat\logs (though different deployment types may offer these logs in differently named folders). In either log, one of the lines tracked during the instance startup should look something like this:
16-Jul-2022 15:46:37.131 INFO [main] org.apache.catalina.startup.VersionLoggerListener.log Command line argument: -Xmx256m

Second, for someone WITHOUT access to the logs (or FR), you can get a CLOSE (but not EXACT) approximation of what the heap max (xmx) was, using this java object and method:
CreateObject("java","java.lang.Runtime").getRuntime().maxMemory()

That will be in bytes, so if you divide it by 1024/1024, that will be in mb. Again, it’s not EXACTLY the same as the XMX, because we don’t really get the exact value in the XMX, but for instance I found that with an XMX of 256mb this reported 240mb, while for an XMX value of 1024 it reported 910. (The difference between the actual and reported value may vary for any number of reasons.) At least this will give a reasonable indication of whether the value you THINK you set is indeed what the max JVM heap size is.

Third, FWIW, FusionReactor also shows in multiple places what the heap max is (either that “reported max heap” or the actual XMX value), because again it can be very important to be able to confirm that.

Again, my original point is that some people set the XMX in some given way but then it may turn out that Lucee/Tomcat for some reason does NOT use that value they set, so their heap may be far smaller than they think, leading to OutofMemory errors.

2. Moving on to what MAY be causing excessive heap use

If this is NOT your issue, then I realize you will wonder, “so what’s causing me to run out of memory?” Zack and others have offered some suggestions.

I would assert again that FR can really be the next best tool for finding what’s amiss. And some good news is that in my FR video playlist, one of them is specifically, “Troubleshooting JVM memory problems with FusionReactor”.

Hope that may be helpful. While it’s now a few years old, I just watched it also and feel it still conveys the primary points I would make in helping someone address memory problems.

That said, I would add one concluding topic–and I will, if I ever reprise it–for some people, raising the heap used really is the right solution. It may feel like you’re just “delaying the inevitable” if you would hit it again, but often I help people find that for their typical workload and nature of their app (and without focusing on reducing heap use), there may be some heap size value (above what they’re using) where things simply remain stable for days, weeks, or months of uptime. That may be good enough.

I understand in your case @thequeue you would likely feel that’s not the right solution, as it seems “nothing has changed” for you but Lucee reinstallation. So you really want to know “what is causing MY out of memory problem”. And that’s why I have been pressing the first point. And perhaps using FR (or the techniques Zack and others may offer) will help you.

As always, I do write my replies in a way and with the hope that I may help even more readers than the one person who is asking a question. Maybe they may still take value from all the above.

3. A change in the Lucee Admin graphs reporting heap values

Finally, let me now address the confusion over the Lucee Admin heap info. I see now that the version you are on (and indeed that screenshot in the docs) do NOT allow you to see that info.

It’s not that I was saying it would show the min and the max. Instead, I was recalling how the memory graph would (in the past) at least help you confirm if the max was at least close to whatever you felt you’d set it to.

Let me explain first how:

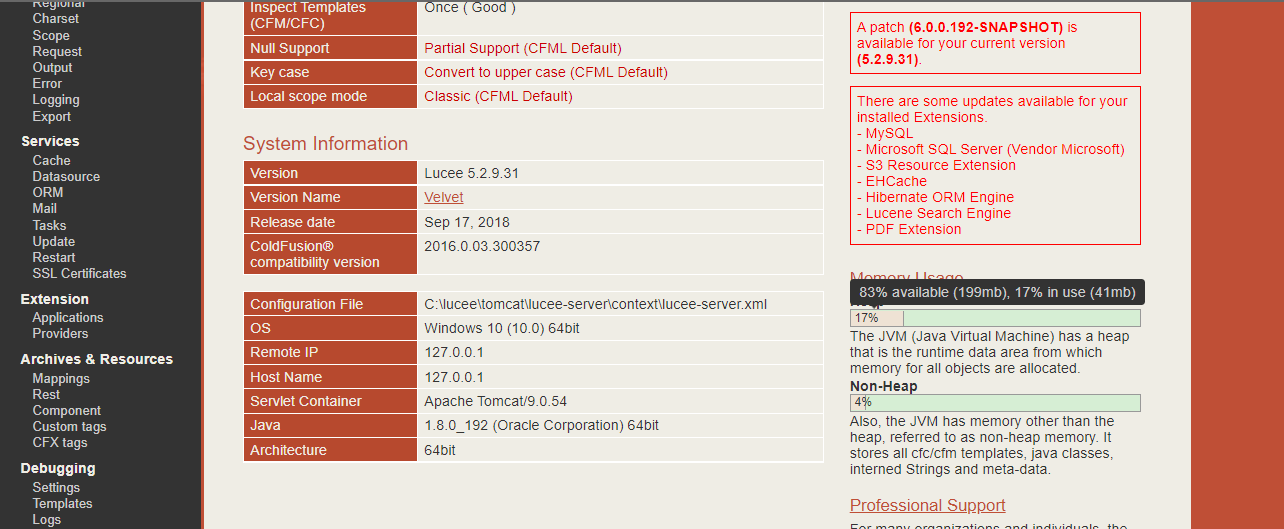
  • In earlier releases, that graph DID offer more. See my attached screenshot below.
  • Notice how I show it depicting that if you moused over the memory graph, it popped up additional info reporting the heap available and in use. One could add those together to see if that was close to what you expected the heap max to be. (Like the java method calls above, it would not be EXACT but it would be close).

As for what changed and when, for anyone interested:

  • Notice first that my screenshot shows it’s from a 5.2.9.31. I know it’s a bit old. I just had not yet updated this Lucee instance for a while, on one of my dev machines. Anyway, when I wrote my previous reply from my phone, I was recalling having seen these mem used/available details in the past in Lucee
  • And I know @thequeue indicated they were on 5.3.8.189. So once I returned home, I did update to that version first, and I see now that the graph looks a bit different (indeed it looks like what was in that docs page)
  • Sadly somehow they have REMOVED the feature where you could mouse over the graph, to have it popup with those available/in use values. (And I even updated to the latest available release, 5.3.9.141, and it’s still this way. I even went to the latest available 6 snapshot, 6.0.0.192, and the graph is as in 5.3.) I don’t know when things changed from the graph in the screenshot below. I did try to find that but could not.
  • Finally, FWIW, I did indeed look at that doc page before sharing the URL in my first reply about it above. I just didn’t know if the lack of it showing the popup (of available/in use memory) was simply because whoever took that screenshot didn’t think to show it. I just wanted to be able to point to the only doc page I could find which offered that admin memory graph image at all.

Sorry it led to the confusion, but this all may interest some.