We’ve been having a strange issue with our production servers ever since we moved from Railo over to Lucee. The problem is intermittent, and we can’t quite nail down what exactly is causing it. I have been looking into it and can recognize the symptoms that lead to it crashing, but I’m not sure how to go about troubleshooting it and was looking for some ideas.
Problem description:
The server will, after some period of time, sometimes become unresponsive to web requests. They will hang until they expire. Once this starts happening, no further requests will be accepted.
Symptoms:
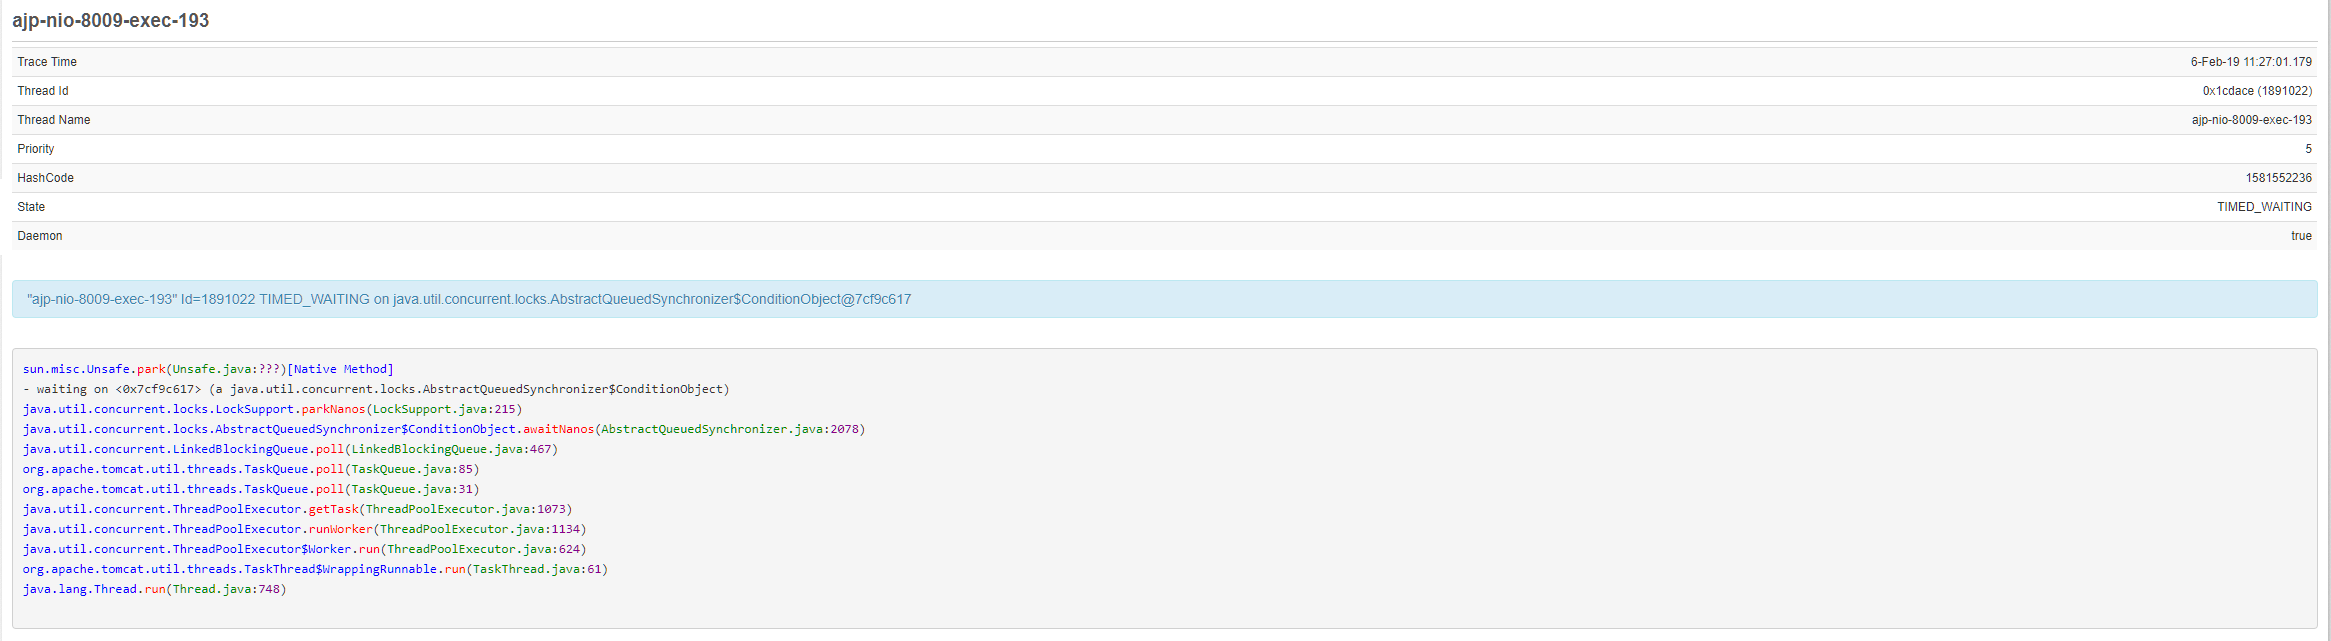
Using Fusion Reactor, I have noticed that servers which develop this issue have a high number of threads showing under Resources > Threads. Specifically, a high number of ajp-nio-8009-exec-XXX threads seems to precede the issue. I observed a server earlier today which had ~150 of these threads in the TIMED_WAIT state. Soon after that it crashed. After the crash and the requests have expired, these threads all get set to WAITING. (Example capture from FR below)
We aren’t sure if this is a problem with Lucee, Tomcat, the Boncode connector, or what. IIS is still responsive. It will serve up static html/txt files just fine. FusionReactor can still pull data from the server, so it seems like Lucee is still running fine. This leads us to believe the issue lies with Boncode and/or Tomcat, but we just don’t know how to go about testing/troubleshooting.
Mainly we’re looking for ideas for things we can look at.
We also have some Railo servers in production currently, and don’t have this problem. It’s Railo 4.1 which uses the older Java 7 and Tomcat version, so maybe that’s why. I also noticed that the threads on those servers are named differently. (ajp-bio instead of ajp-nio – probably irrelevant but who knows)
I’m happy to provide any other details that are needed, but I wasn’t sure what info would be helpful.
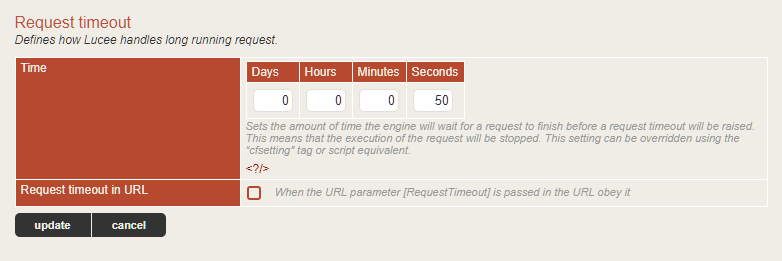
What version of Lucee? Also do you have a request timeout that’s kicking in and killing pages? If so, try turning it way up so it doesn’t kick in. There is a known issue where Lucee killing threads can zombie the thread handling the connection pool from Tomcat. It could be what you’re seeing here.
On most of our servers we have Lucee 5.2.5.20, but we did put the latest release (5.2.9.31) on one server to see if it was any better. (It wasn’t, crashed yesterday.)
When you say request timeout, are you talking about the request timeout setting that can be configured in the administrator?
Yes, that is the setting. Turn that sucker off. MIcha has said himself never to use it! Adobe ColdFusion doesn’t kill threads, but instead interrupts them politely to give them a chance to finish what they are doing and clean up. This is why Adobe CF is so bad at stopping threads. Lucee on the other hand murders threads dead with a sledgehammer which is why it’s so good at stopping threads. It can also corrupt their state in the process. That’s the price you pay for swift punishment of long running requests.
Crank up your request time out to something large so it doesn’t kick in and see if that makes a difference. It may be unrelated, but it’s worth eliminating as a factor. If that is the case, there is a workaround I will share with you to enable a hidden feature of Lucee to change how it clobbers threads, but it comes with its own drawbacks so we’ll hit that bridge when we get to it.
Good question. Micha’s response in the past has been that you should tune the slow parts of your app so they’re not slow. Obviously! I would recommend having a timeout on any external operations such as HTTP or cfquery calls so they don’t get hung. They are very hard to kill. If a thread is processing CFML code but just slow or in a big loop, you can kill it via FR manually which uses the interrupt method first and ONLY the sledgehammer approach behind several warning confirmations. I would start by finding out what is running long and finding out why. FusionReactor makes this VERY easy with the “longest running requests” and “slow requests” pages mixed with their amazing request profiling.
It would take 6,000 seconds. (a little over an hour and a half) or am I misunderstanding what seems like a really simple question? I would hope you have no pages in your app taking 1.5 hours to complete though!
Just like any page that takes a while to complete. Again, not sure I understand the question. A page that takes 1 second, 10 seconds, 30 seconds, or 5 days work the exact same. The browser sits there until it hears back from the server! Well, actually your proxy server or browser will likely time out before 5 days, but you get the picture.
Okay, I see. I just wasn’t sure if there was some behind the scenes handling of request death for Lucee if the request timeout was so high.
We do use timeouts on our queries and http calls, so that should be fine. Generally the app is pretty tuned, so we shouldn’t have any issues if this works.
If it does work, we can just keep an eye on FusionReactor for stuff that is taking too long and adjust it accordingly.
We’re going to update two servers and set a request timeout of 1 hour, and see if it makes any difference in the total number of threads being created on those servers. I’ll let you know how it goes after we observe it for a day or so! Thanks!
The way Adobe at least used to do it was a thread was responsible for asking if it had timed out. Which of course, doesn’t do any good if a thread is busy waiting on an external IO task. Lucee has a Controller thread that runs 24/7 and monitors all running threads like big brother. If it sees a thread that has outlived his timeout, Lucee murders him, I believe using Thread.stop() or similar. There is not any more or less overhead depending on your request timeout it’s just a matter of how long big brother lets you live before the hammer falls.
Also, get all your servers on the latest stable. I think there were some stability issues in earlier versions of 5.2 which may not be affecting you, but it’s best not to have too many factors at play.
Your suggestion seems to have worked. We rolled the change out to a couple of production servers last week and watched it, then slowly rolled it out to others. The updated servers haven’t had any more crashing issues, so it seems to be working! Thanks for the tip!
We went ahead and updated to the latest release as well.
@Jason.Weible Ok, so now that you’ve found that it seems to be the case that Lucee’s request timeout was creating zombie threads from the web connector, here is another step you can try. This is a sort-of hidden feature in Lucee that you can enable via an environment variable or Java system prop.
lucee.async.request.handle=true
It will run every HTTP request in a separate async thread that is fired off from the original HTTP thread. The benifit is the Request Timeout can hammer threads all day long but it won’t ever hammer on the web connectors threads directly and won’t turn them into zombies. The downside of this is it really screws up monitoring tools like FusionReactor since they only look at the main HTTP thread so you’ll stop getting stats of JDBC connections and your stack traces will all just show the threads are simply waiting for the “real” thread to complete. If you really want to have your request timeouts back and you’re willing to live with how this setting affects monitoring tools, you can use it.
I would personally recommend keeping your request timeouts at bay and tuning any slow pages, but I wanted to make sure you were aware of this option. Plus, I was waiting to talk about it until we knew whether it would apply to you.
Okay, so we’re not completely out of the woods just yet. We’ve had a one server crash each of the past two days. Same symptoms as before, a high number of ajp-nio-8009-exec-XXX threads showing up in FusionReactor after Tomcat becomes unresponsive. Things are generally better overall, though!
We made the request timeout something ridiculous (like an hour) in the Lucee Server Administrator previously. We do have a few places in the code where we were overriding the previous (20 second) timeout via . Should we eliminate those as well? I’d imagine they function the exact same way as the admin setting.
We also have places where we utilize cflock. Could that be contributing? I wasn’t sure about if that behaves in the same manner or not.
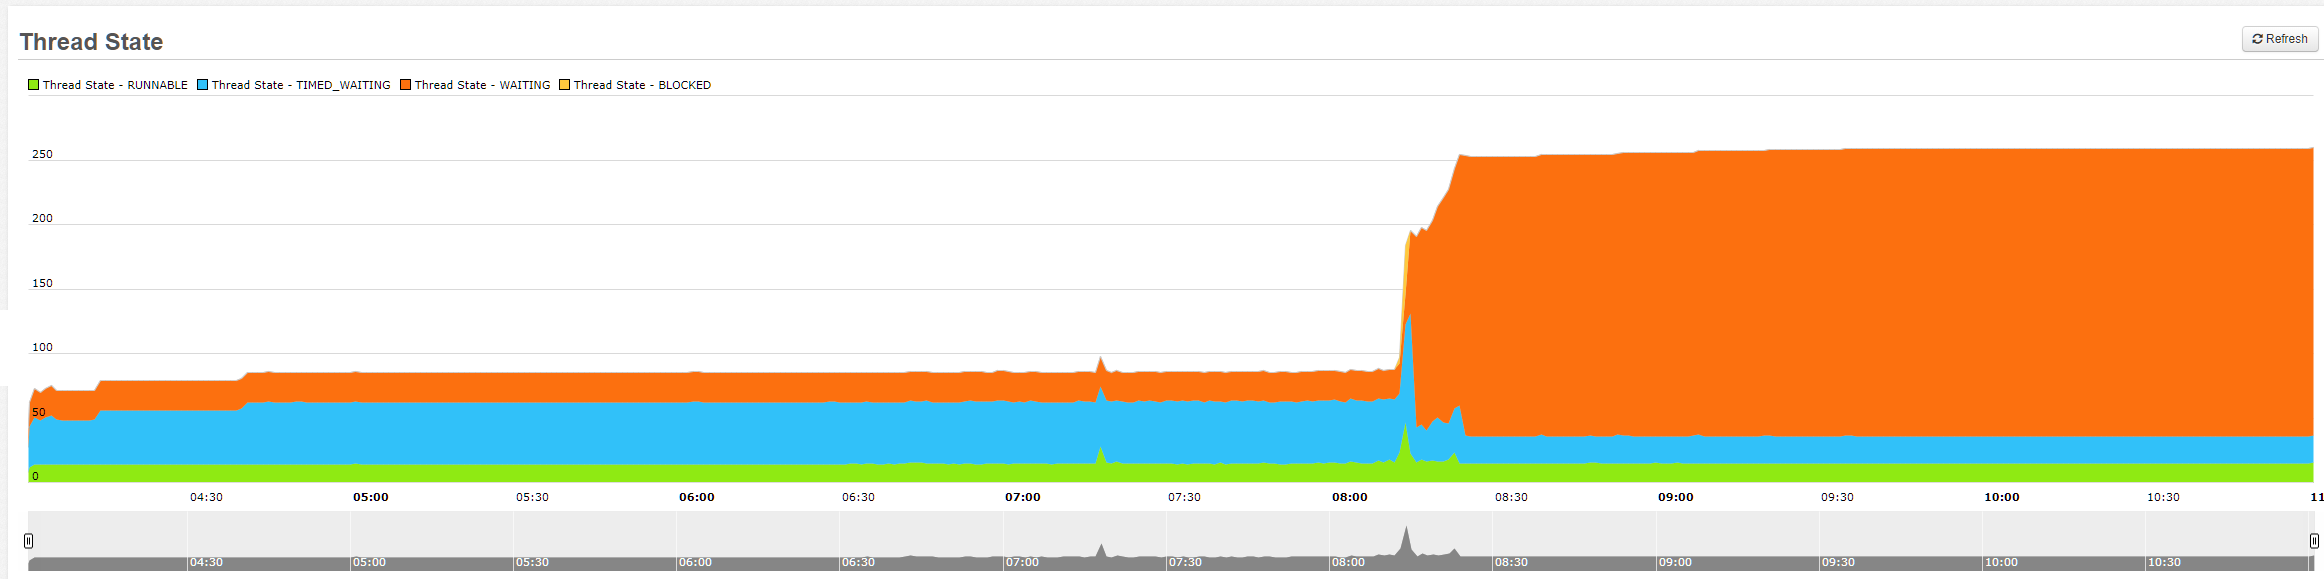
Just for fun, and in case it helps, here’s what our thread state graph looks like from FusionReactor. The crash occurred right at the spike ~8:15am. The graph from the day before on the other server looks very similar.
Also, how should our Boncode connector definition in the Lucee/Tomcat/conf/server.xml file look? Right now it’s pretty simple, but I see there are some parameters you can add around request timeouts there as well, which I don’t think we’ve ever had to do in the past with Railo.
Did you ever determine the cause? I have a new Linux instance running on Amazon with Lucee 5 and MySQL. Lucee seems to stop responding daily. Other non CFM pages respond. The process appears to still be running but responds to web requests with service unavailable. I execute a restart via the command line and it resrarts quickly.
No, we still haven’t been able to solve it. It definitely seems to be load related. Summer is a slow season for us, and we’re not having the issue now.
In addition, it doesn’t seem to happen on Windows 2008 servers, and I think also Windows 2012 servers were okay. It started happening with Windows 2016 version.
Not completely. I increased the memory and it stopped happening daily. I have some WordPress sites running MySQL on the same server and every so often, Lucee crashes and records an out of memory error. I believe the issues is those WordPress sites getting hammered by bots and running up the memory usage so Lucee cannot get what it needs at a certain time. I think the added memory helped but is not the end solution. Luceee now stops 1-2 times a month.
(Tomcat crashed yesterday afternoon with around 400 users on the site. Same today around lunchtime. Would be useful to be able to see what is actually happening as there are no ‘CFERROR’s generated. Apache and all other services seem stable.)