In the abbreviated code below, I call function1 with arguments in an array. In this function, depending upon the number of results from a query, I branch to one of a number of invocations. I use Chrome’s DevTools for debugging and the one shown, FP3, fails with a “GET” error 500 but I can’t understand why.
Ok, here is where I further show my ignorance, where should I see the stack trace because it didn’t appear in the execution window. This is all I see in Chrome DevTools:
What do you see in the browser if you request that URL above in your browser? A blank page? You should see the stack trace in your browser, unless you’ve setup Lucee to not show them. If the errors are not shown, check your application log files. You possibly won’t see those errors in Chrome dev tool (which is mostly used for debugging client relevant issues). Search the directories of your Lucee installation and webroots for application.log files and look at them.
No problem. Just keep calm and don’t forget the joy when coding :D.
@new2lucee the logfile content you’ve posted above isn’t the application.log but the request logfile. These only show the requests sequence with data. As you can see the last request is showing a 500 http status, instead of 200. That tells you that there was an exception, but it doesn’t tell you any reason or detailed description about the exception. Let’s try another approach.
Fom the content I can see that your application does some ajax requests to retrieve json data. Maybe that is the reason you are not seeing any errors displayed directly in your browser. The best way to see exceptions when coding with ajax is to view the responses returned from within your chrome dev tool. Do the following steps:
Step: Open the chrome dev tool
Step: Open the network panel to be able to view your network activity. See instructions here. When active you will be able to view a list of all requests that your browser initiates. Also, make sure to disable cache by ticking “Disable cache”.
Step: Start browsing your web app to the point that your application errors.
Step: Find the request that es returning the error. In your case that should be an entry as follows: /StockTrfComponents.cfc?method=getSrcCustFPProducts&returnFormat=json&argumentCollection=%7B%22parms%22%3A%5B%2229%22%2C%22480%20%22%5D%7D&_23195223 . You should see it highlighted in red in the “network activity panel”, because the dev tool detects the 500 http status error.
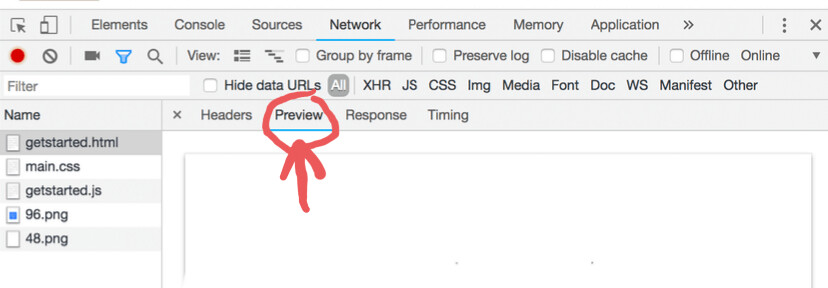
Step: Select the errored request from step 4 by clicking it and select the “preview” tab.
Then you should be able to see the page in a rendered way and more information about the specific error. That tab simply shows html like you would be browsing it. Because Lucee outputs errors as html by default, you should be able to see the error details there.
If you want to see the plain response (without html rendering like source viewing) click the “Response” tab just besides the “Preview” tab. There you should be able to see the raw source data.
Hmmmm… I think your StockTrfComponents.cfc method “getFPs3” requires only one struct as an argument and not a set of arguments. You can check it by looking at the code of that components method “getFPs3”
If so, AttributeCollection attribute of your cfinvoke code will try to serialize the variable theParms into a set of arguments first and pass the arguments like so to the method:
getFPS3( theParms.p1, theParms.p2 )
instead of just
getFPS3( theParms )
I suspect and assume that’s the issue.
I’d try invoking the method using cfinvokeargument instead of AttributeCollection, like so:
Andreas, my hasty response was incorrect. It still has the same error :
The parameter [theParms] to function [getFPs3] is required but was not passed in.
I’m going to change the logic so that the decision-making is in the program and not the cfc, because I know that passing params from program to cfc works whilst cfc to cfc has issues.