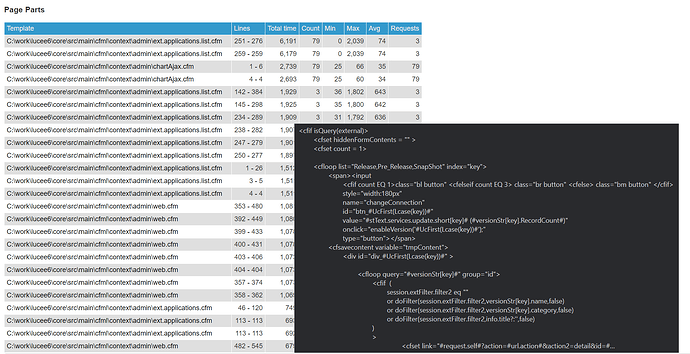
Have you ever wanted to know which bit of a .cfm file was slow?
Add the following lines to your Lucee 6 .CFCONFIG.json
,"executionLog":{
		"enabled":true
		,"class":"debug"
}
Then my Performance Analyzer v 2.1.0.9 plugin (GitHub - zspitzer/lucee-performance-analyzer: Performance Analyzer plugin for Lucee, to be used in the Lucee Admin or Standalone.) will show you the following super useful debugging report
Thanks to @micstriit for the tip about the existing functionality
There’s another improvement coming up in Lucee 6 as well, logging UDF and member function execution times
https://luceeserver.atlassian.net/browse/LDEV-3427
Once that’s completed and merged in, you can really get a detailed picture of what code is running slowly with these two new Lucee 6 features.
Alas, don’t ask me about the Lucee 6 roadmap just yet, but I can say 5.3.8 is going RC2 next week
