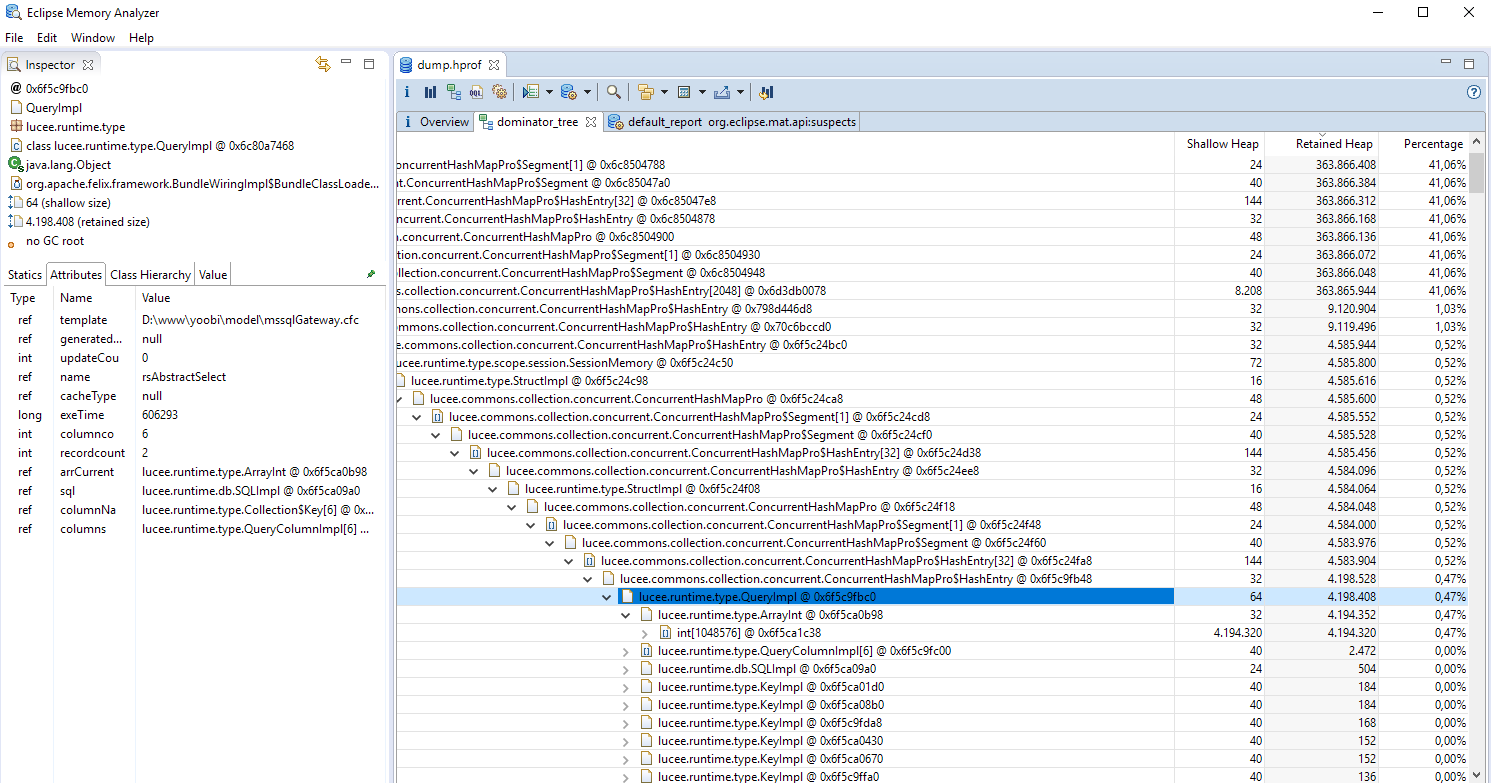
I’m analyzing a heapdump because of a memory problem on one of my servers. The memory is largely used by a query in the session scope, although the query is just a few record. What strikes me is every query contains a very large ArrayInt (1.048.576 items).
When investigating further it seems every query in memory has the same ArrayInt with exactly the same number of items. What are your opions on this? Is it a bug?
Although I’m not able to reproduce this in a testcase the issue is still occuring in my application (coldbox framework). Somehow the arrCurrentRow (ArrayInt) attribute of the lucee.runtime.type.QueryImpl object Is getting larger over time.
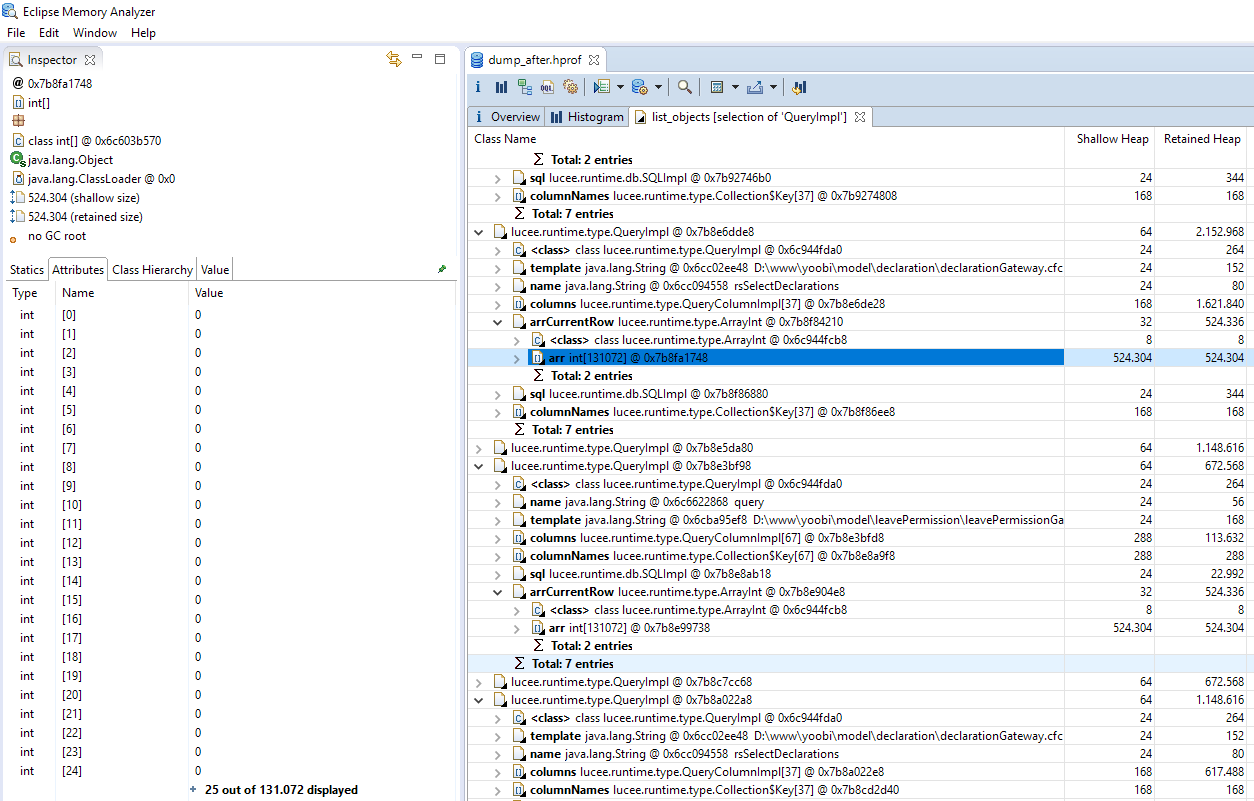
Restarted the server yesterday and the biggest arrCurrentRow (ArrayInt) now contains 131.072 items.I also see occurences of 65.536, 32.768, 16.384, 8,192 items … al the way down to 32 items.
Off the top of my head, here some things to look at/try.
Can you try the jTDS driver?
Do you have a huge return result (as in record number not size)?
Query cache setting?
[Edit]
Can you try 5.2.7?
The current row is PageContext specific (which is kinda neat), which means if you save a query in the session, and access it from two diff Contexts, the iterator positions will be different. (Which is also good I guess, never really thought about it - we always explicitly loop a variable from 1 to RecordCount and use explicit indexes)
ArrayInt is an int[]. (makes sense) . But it is an Array - which means it’s not a hash lookup, it’s a chunk of memory… which is… well… problematic because
The current row is indexed with the ID on the PageContext of the request - which is allocated in CFMLFactoryImpl from idCounter++ and grows as the server runs.
So if the context starts at 1, and keeps growing everytime you have a request… every query from that point forward will allocate LARGE arrayints.
Example, thread 10
blah = new Query
cfloop query=“blah”
blah.COL ← creates a arrCurrentRow with 32 entries (minimum) and saves the current index at index 10 (31 empty entries)
PageContext 1000
blah = new Query
cfloop query=“blah”
blah.COL ← creates a arrCurrentRow with 32 entries (minimum), grows the array to 1000 entries, and saves the current index at index 1000. (999 empty entries)
PageContext 10000
blah = new Query
cfloop query=“blah”
blah.COL ← creates a arrCurrentRow with 32 entries (minimum), grows the array to 10000 entries, and saves the current index at index 10000. (9999 empty entries)
The longer time goes on, the more inefficient it’ll get.
Your best bet at reproducing it is to burn through PageContexts as quickly as possible. (Maybe cfhttp against a lucee .cfm file 100 times, then allocate a new query and see how big the arrayint is)
I imagine this should be hash based instead of array based, or PageContext should be extended to hold arbitrary context information for tags running on a page. At the very least the object should perform well when the query is used in a single pagecontext, as using it from multiple is probably the more rare case.
Upgraded to the latest Lucee version (5.2.8.50) and the latest Microsoft SQL Server drivers (6.2.2.jre8).
Unfortunately this problem is still occuring on production, while not being able to reproduce with a testcase After a few days I really need to restart the servers. GC will go crazy because every query will have an arCurrentrow with a few million items.
Maybe someone with the Lucee team has an idea what’s going on?
what is important to point out that Lucee has a pool for PCs, so the size is not growing for every request, only in case you have multiple request at the same time (including cfthreads what get it’s own PC).
When this implemenation was written (a long time ago) the id was not a static id, is was more like the stack size of the current running threads, a value of course not growing over time. so when the implementation of PC.id changed we have forgotten that query is depending on a low number. a typical example of using a unindential side effect on a system (always expecting low number).
So why is an array used in the first place and not a map?
Speed, we needed a solution that is as fast as possible and a native array was the fastest one
How can we fix this?
make sure the id is always low again, unless you have hunderts of threads open at the same time.
find a different solution
further work on this will only be documented in the ticket…