Memory issue with 5.3.6.61

Thanks for chiming in with your experience, which confirms it only affects certain “busy” conditions. Unfortunately that makes it hard to identify the issue.

If you want to move on from 5.2, we’ve found 5.3.4.85 to be very solid. Don’t be put off by the SNAPSHOT label.

Thanks for sharing this info Julian.

Anyone have input if anything is being addressed in a future release around this? Is bug created? I am trying to decide next steps and backing up a release may be something we pass to QA next week for review. We always just deploy released versions in production.

Julian, are you still running snapshot 5.3.4.85? Or have you found a newer snapshot or release candidate?

Yes, seems like we’re stuck on this version for now. Can’t really keep testing newer releases as the only way of doing so is by applying them to this particular production server at busy times, which is obviously very disruptive if they fail.

Had another go at upgrading the troublesome server to the current stable release 5.3.4.47 and it seems the issue is still there.

But we have identified the specific area of the application which seems to be triggering it.

As before, the patch was applied on a Sunday and there were no issues until Monday morning when we started to see memory use rising and garbage collection recovering less and less.

We noticed though that jumps in memory were happening on the hour, which led our attention to a fairly complex scheduled task which, as it happens, runs on the hour during business hours only.

So we disabled the task temporarily and sure enough, memory usage stabilized around its current level. You can see all of this in the folowing FR memory graph:

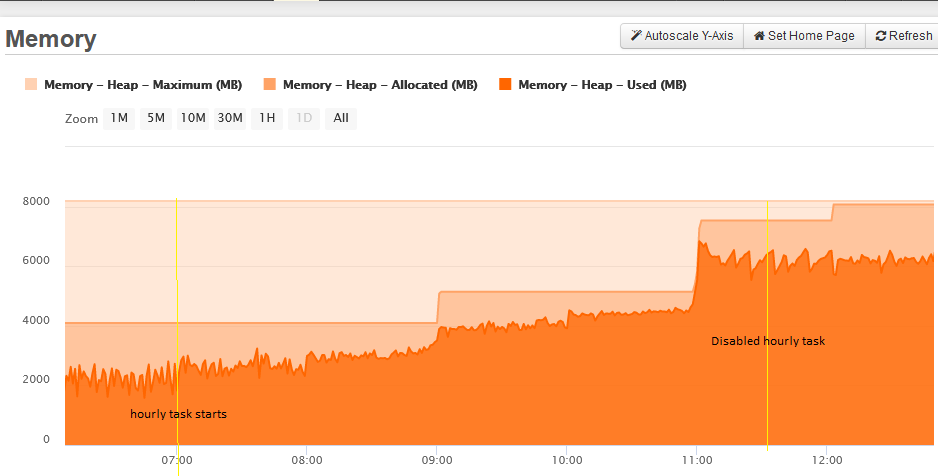
As I say, the task is complex and we’re not sure which specific element is responsible, but it runs in a separate thread for one thing and performs various operations using parallel closures, so it seems likely it’s related to threading.

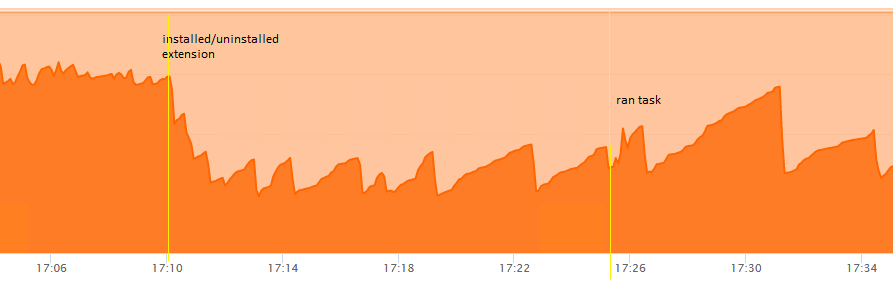
By accident I also discovered something strange. The task needed to be run again so we decided to do it manually so we could observe the expected rise in memory usage. Although not sure I’d have the expertise to understand it, I thought I’d try the Heap Dump extension Zac mentioned a while ago. I installed it but couldn’t see any way of accessing it or find any docs, so uninstalled it.

But when I returned to my FR graphs I saw that memory usage had dropped significantly at the exact moment of installing the extension. Note I didn’t run the heap dump tool, just installed it. I’ve replicated it since: just installing the extension clears out a bunch of memory. Perhaps installing any extension has this effect?

Not only that, but with the memory cleared we ran the hourly task again manually and this time GC seemed to be more effective afterwards as illustrated by this graph:

I’m not sure yet what to conclude. There’s clearly something wrong with Lucee versions 5.3.5+ in certain conditions, and our experience suggests it may be related to threads/parallelism.

But at least we know enough now to be able to control it, which makes testing easier.

@ggriffit does any of this make sense in your context?

the head dump is found here in the admin ( the latest snapshot has an xml bug and admin plugins don’t load, see [LDEV-3194] - Lucee) 5.3.8.119 is ok

I think installing a extension does a bit of a reset, hence the behaviour you’re seeing

Thanks Zac. I poked around the extension and saw that the UI should be under Debugging but for some reason it wasn’t showing up there for me. Just tried it locally and yes I can see it now.

The reset is useful because it means we can avoid restarting Lucee which is disruptive.

But it doesn’t solve the issue unfortunately. We need to run that task and having re-enabled it, memory is now slowly filling up again and is not far off the ceiling. We can’t run a prod server like that so will have to revert to our known stable version 5.3.4.85 until we can refactor the task code to avoid this condition.

hmmm, the scheduled task logic was refactored to fix the DST bug (but that’s in only 5.3.8.82)

https://luceeserver.atlassian.net/browse/LDEV-1724

each scheduled task runs in a persistent background thread which sleeps most of the time,

you could try updating the scheduled task after it runs, which creates a new background thread, just bump the scheduler.log level up to trace to confirm it’s being recreated

once you have a heap dump, you can load it with Eclipse Memory Analyzer Open Source Project | The Eclipse Foundation and explore it

I don’t think it’s the scheduling logic because we can trigger the issue by running the task manually.

Honestly I don’t know anything about heap dumps and wouldn’t know what to look for. Even Brad admits it’s not for the faint-hearted!

1 Like

I should add that, even though I’ve pointed the finger at threading I’m not sure of that either. The other server we run also does quite a bit of parallel processing (not as complex), and works fine with the latest release.

the servers are identical, same code, same versions n all?

No, identical stack, but different applications. As I say we’ve identified that it’s a specific bit of application code that’s creating the condition, which involves a lot of parallel threads.

I created a heap dump using the extension at a point where the heap was about to reach the max. A warning to others: doing this took over the server and prevented it from handling anything else for over half a minute!

The result was a 12GB file which I loaded into Memory Analyzer. That then completely took over my laptop for probably more than an hour as it parsed the data and spit out a “Leak Suspects” report. I’m afraid it doesn’t mean a great deal to me but the summary is as follows:

Problem Suspect 1

One instance of "lucee.runtime.CFMLFactoryImpl" loaded by "org.apache.felix.framework.BundleWiringImpl$BundleClassLoader @ 0x6005bbf08" occupies 4,094,718,480 (56.41%) bytes. The memory is accumulated in one instance of "java.util.concurrent.ConcurrentLinkedDeque", loaded by "<system class loader>", which occupies 4,094,717,824 (56.41%) bytes.

There are no other “suspects”, but there is more detail which I can share with anyone who might understand it.

@Julian_Halliwell you can edit the init file for MAT and increase it’s RAM. I try to give it AT LEAST as much RAM as the heap dump is, if not more or you’ll have tons of GC church (MAT is written on Eclipse, and therefore Java underneath). If you can reproduce memory issues, it’s actually better to do so with a smaller heap just to make it more manageable.

The problem suspect above may be an issue, but much more info would be needed. If you want to zip your heap dump and share via Google drive, I can take a look. I don’t recommend sharing it publicly since sensitive info can be found in them.

what do you see in the application.log for entries with Reset xxx Unused PageContexts?

seems like possibly the pageContext cache is getting out of control ? It’s hardwired to be limited to only 100

perhaps this commit is the culprit?

https://luceeserver.atlassian.net/browse/LDEV-2559

Thanks @bdw429s. I had increased the MAT’s -Xmx to 12GB, as it wouldn’t load the 11GB+ dump file with any less. But my laptop only has 8GB of RAM so it was forced to use swap space, hence the painful performance.

I generated another server heap dump today at a lower point in the memory increase cycle, but with the hourly task still having run a few times, and that’s yielded a dump file of 7.5GB. That zipped down to 1.75GB, but with 7-zip compression it’s 700MB. Really appreciate your offer and I’ve made that 7z file available to you on G-Drive privately.

There’s nothing the application.log, even at INFO level.

I think you might be onto something with LDEV-2559 though: I actually ran the leak check again on today’s heap dump and in addition to the problem reported above it also flagged up 2 more suspects: java.lang.Thread and lucee.runtime.type.ArrayImpl

Thanks for the detective work.

did you note how many items (pageContexts) that contained?

the problem about the application.log not being written was subsequently fixed, i’m guessing there are some useful clues about this problem which we can’t see due to it

Where would I see that number?