@michaelborn_me :
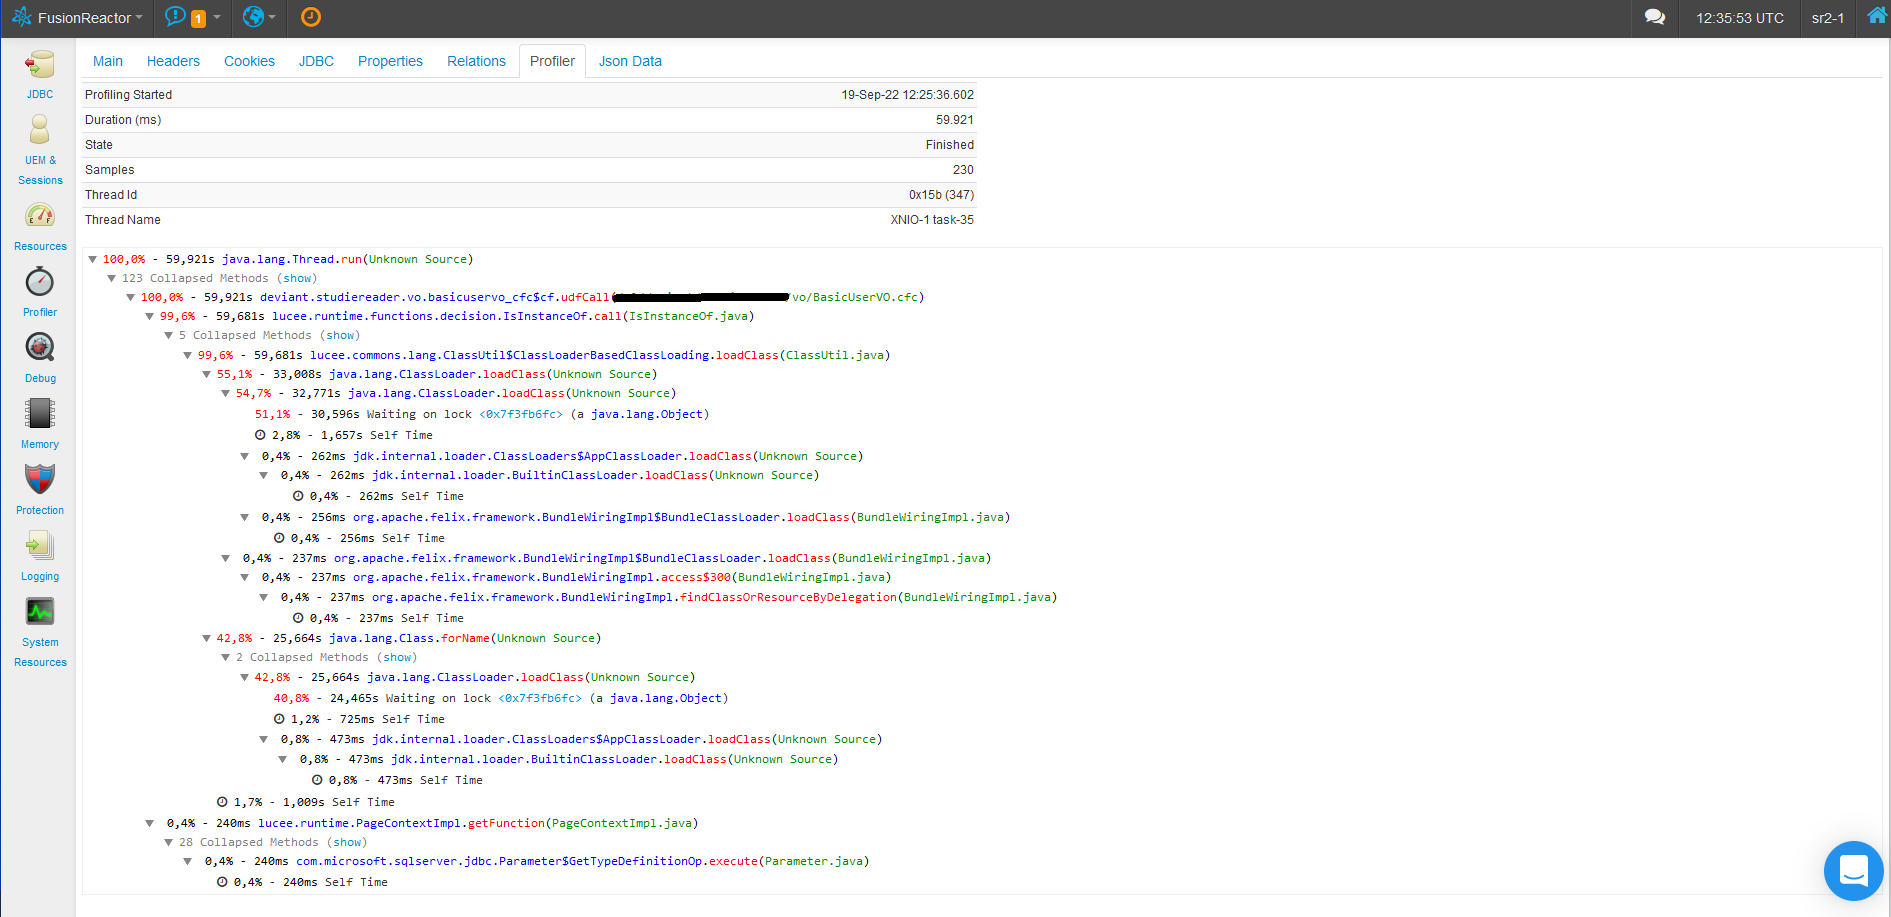
Pardon my ignorance, but that sample number has nothing to do with the number of executions of any piece of code… correct? The sample count is merely the sample rate times the profile time. In this example, 230 / 60 seconds is roughly 1 sample every quarter second.
@bdw429s
Correct. The samples is simply how many stack traces FR took, which by default are every 200 ms. That doesn’t tell us how many times a given line of CF code executed.
I did not say that FusionReactor’s sample-size is the number of executions of the relevant piece of code. I said the stacktrace resulting from 230 samples is a useful indication.
@bdw429s
If you haven’t made to the point where you can take a given page and know how many times a line of code ran, I’m confused what you’ve been doing in your attempt to reproduce the performance, as that would have been the very first step in my mind!
I am, and have been, doing that hundreds of times daily, from day one. With positive results.
For example, performance improved when we replaced isInstanceOf - which, incidentally, appears in the FusionReactor stacktrace. Using name-value syntax for the arguments in certain calls has also helped.
However, it has so far been a question of putting out fires. I have yet to pinpoint a common thread - pun intended.  - underlying the drop in performance. In the beginning I only suspected there might be one. Now I do believe there is at least one. And it’s got to do with classloading in Lucee.
See: https://lucee.daemonite.io/t/are-lucees-custom-class-loaders-single-threaded-or-multithreaded/11123
The challenge is to come up with a repro case which I can share in this forum.
Alas, the repro case has been a secondary aim. Our primary aim has been to resolve show-stoppers and bottle-necks, enabling us to open shop every day.
@bdw429s
And just to clarify, I hadn’t suggested that you try and reproduce the entire server slowness, just that you take what appears to be a slow bit of code and urn it in a loop the same number of times and see how it performs.
No need to clarify. I have enough experience and know enough analysis not to attempt a Hercules on the entire server. I understood what you meant right from the start.