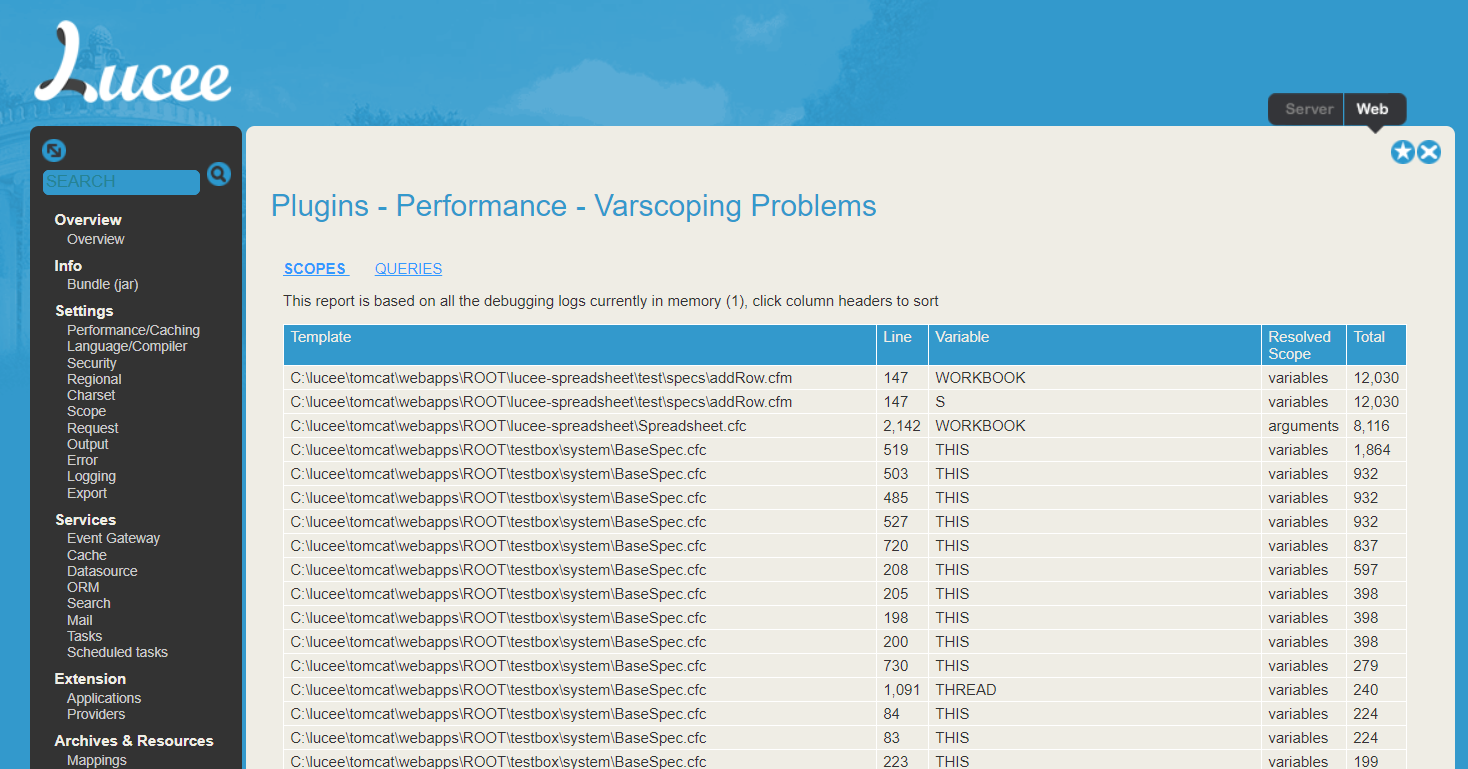
Just published v1.0.0.1, it’s available via your Lucee Administrator.
It’s a simple little plugin which provides a summary view of all the debug logs, I’ve been
using these scripts for a while to track down performance problems.
I just wanted to see what URLs are hitting my webserver [application server].
FR is too expensive and it also keeps crashing my server.
Recently the DNS Server [on my VPS] has been hogging memory [eventually crashing my Lucee application server], so I have had to restart it, every few weeks.
I reckon it might be some kind of mini DDOS attack, pinpointing a form on one of my Coldfusion websites.
If I can see which URL is being hammered, I can comment out the form or tighten up my Cross-Site Request Forgery defence etc
Depending on the version of Java that you are using, you may be able to use SeeFusion:
We have used this for years as a simple, no frills, low overhead APM. It does not include anywhere near the detail that FusionReactor does, but offers enough insight to a server to pick up on some problems. Unfortunately it is no longer maintained and I have not been able to get it working with Java21.
An up-to-date version of SeeFusion would be brilliant to have if anybody knows how to update it.
Thanks. I will see if seeFusion works. I am using Windows 2019 Server, so it’s Java version will probably be fine.
The webserver logs for some reason don’t seem to show anything via IIS Request Monitor → Worker Processes
So, I feel an application server solution is more appropriate.
Doesn’t it put that weird looking Cloudflare screen, before arriving at a website. Or is there a setting to remove that.
I always thought that looked a bit unprofessional?
I’ll have a look at the cost and then decide.
I agree, DDOS is a horrendous experience.
I have already had to take down one entire website, on an older VPS, because of DDOS.
Currently, I am blocking spiders using Windows Defender Firewall Inbound settings. I have set some in IP ranges. This is actually quite effective. But new spiders pop up, every day.
By the way, thanks for the suggestion at looking at the Windows inetpub logs. This has exposed some decent request information.
I used it today to block several new spiders, including TikTok and the Chinese Sogou Bot.
It’s zapped a decent amount of activity.