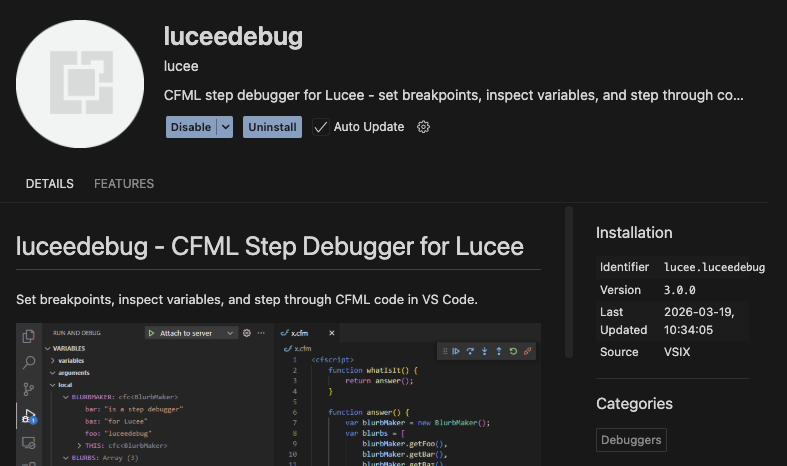
I installed the extension davidrogers.luceedebug, but it shows the version 2.0.12.
When i configure the launch.json, the property secret is not allowed.
I downloaded the source code, build the extension and replaced the files with the new files. Then the extension didn’t start:
Debug adapter process has terminated unexpectedly (Extension host shut down)
I deleted the extension, restarted vsc and installed the extension from marketplace again.
With version 2.0.12, I call > luceedebug: show class and breakpoint info:
Breakpoints luceedebug has:
  (ide)    /Users/mmmm/Documents/xxx/yyy/abc/index.cfm:4 (unbound)
  (server) /home/abc/index.cfm:4 (unbound)

Path transforms:
  PrefixPathTransform{idePrefix='/Users/mmmm/Documents/xxx/yyy/abc/', serverPrefix='/home/abc'}

Files luceedebug knows about (all filenames are as the server sees them, and match against breakpoint 'server' paths):
(Before I build the extension manually, I saw some files…, so I guess i broke it…)
My questions: Is a the new extension in the market place to use?
How can I get this run?
curl/nmap says, the port 10000 is running/open on localhost
OS: MacOS with lucee running in docker Lucee Version: 7.1.0.115-SNAPSHOT
I downloaded the source code, build the extension and replaced the files with the new files. Then the extension didn’t start: Debug adapter process has terminated unexpectedly (Extension host shut down)
I build and installed v3 again, now the extension is running:
luceedebug: show class and breakpoint info shows my set breakpoint at index.cfm and 730 files
I request the index.cfm in the browser and the pages loads, loads, loads and nothing happens. The watch/variables in the IDE are not populated. The small menu bar with “Continue / Step Over / Step Into” is shown and after some seconds the debugger stops. The page then loads as ususal.
I restarted the IDE and now luceedebug: show class and breakpoint info shows my unbound breakpoint and no more files.
I use the docker to mount server folders into one folder:
I still had the old debugger in the setenv.sh enabled, so the port 10000 was used by the old debugger. I removed the file, removed the old luceedebugger.jar and rebuild docker.
Ok, one last issue. When i debug and read the variables scope:
[luceedebug] ERROR: Launcher future exception: java.lang.StackOverflowError
java.util.concurrent.ExecutionException: java.lang.StackOverflowError
	at java.base/java.util.concurrent.FutureTask.report(FutureTask.java:122)
	at java.base/java.util.concurrent.FutureTask.get(FutureTask.java:191)
	at org.eclipse.lsp4j.jsonrpc.json.ConcurrentMessageProcessor$1.get(ConcurrentMessageProcessor.java:54)
	at org.eclipse.lsp4j.jsonrpc.json.ConcurrentMessageProcessor$1.get(ConcurrentMessageProcessor.java:50)
	at org.lucee.extension.debugger.DapServer.createForSocket(DapServer.java:258)
	at org.lucee.extension.debugger.extension.ExtensionActivator.lambda$new$0(ExtensionActivator.java:83)
	at java.base/java.lang.Thread.run(Thread.java:1583)
Caused by: java.lang.StackOverflowError
	at lucee.commons.collection.concurrent.ConcurrentHashMapNullSupportJDK$EntrySetView$1$1.hashCode(ConcurrentHashMapNullSupportJDK.java:464)
	at lucee.commons.collection.concurrent.ConcurrentHashMapNullSupportJDK.hashCode(ConcurrentHashMapNullSupportJDK.java:634)
	at lucee.runtime.type.StructImpl.hashCode(StructImpl.java:358)
	at lucee.commons.collection.concurrent.ConcurrentHashMapNullSupportJDK$EntrySetView$1$1.hashCode(ConcurrentHashMapNullSupportJDK.java:464)
	at lucee.commons.collection.concurrent.ConcurrentHashMapNullSupportJDK.hashCode(ConcurrentHashMapNullSupportJDK.java:634)
	at lucee.runtime.type.StructImpl.hashCode(StructImpl.java:358)
	at lucee.commons.collection.concurrent.ConcurrentHashMapNullSupportJDK$EntrySetView$1$1.hashCode(ConcurrentHashMapNullSupportJDK.java:464)
	at lucee.commons.collection.concurrent.ConcurrentHashMapNullSupportJDK.hashCode(ConcurrentHashMapNullSupportJDK.java:634)
	at lucee.runtime.type.StructImpl.hashCode(StructImpl.java:358)
	at lucee.commons.collection.concurrent.ConcurrentHashMapNullSupportJDK$EntrySetView$1$1.hashCode(ConcurrentHashMapNullSupportJDK.java:464)
	at lucee.commons.collection.concurrent.ConcurrentHashMapNullSupportJDK.hashCode(ConcurrentHashMapNullSupportJDK.java:634)
	at lucee.runtime.type.StructImpl.hashCode(StructImpl.java:358)
	at lucee.commons.collection.concurrent.ConcurrentHashMapNullSupportJDK$EntrySetView$1$1.hashCode(ConcurrentHashMapNullSupportJDK.java:464)
	at lucee.commons.collection.concurrent.ConcurrentHashMapNullSupportJDK.hashCode(ConcurrentHashMapNullSupportJDK.java:634)
	at lucee.runtime.type.StructImpl.hashCode(StructImpl.java:358)
	at lucee.commons.collection.concurrent.ConcurrentHashMapNullSupportJDK$EntrySetView$1$1.hashCode(ConcurrentHashMapNullSupportJDK.java:464)
	at lucee.commons.collection.concurrent.ConcurrentHashMapNullSupportJDK.hashCode(ConcurrentHashMapNullSupportJDK.java:634)
	at lucee.runtime.type.StructImpl.hashCode(StructImpl.java:358)
....
Well, I often have the problem, the variables/watches disappear. I also have to click “stop over” twice to get to the next line.
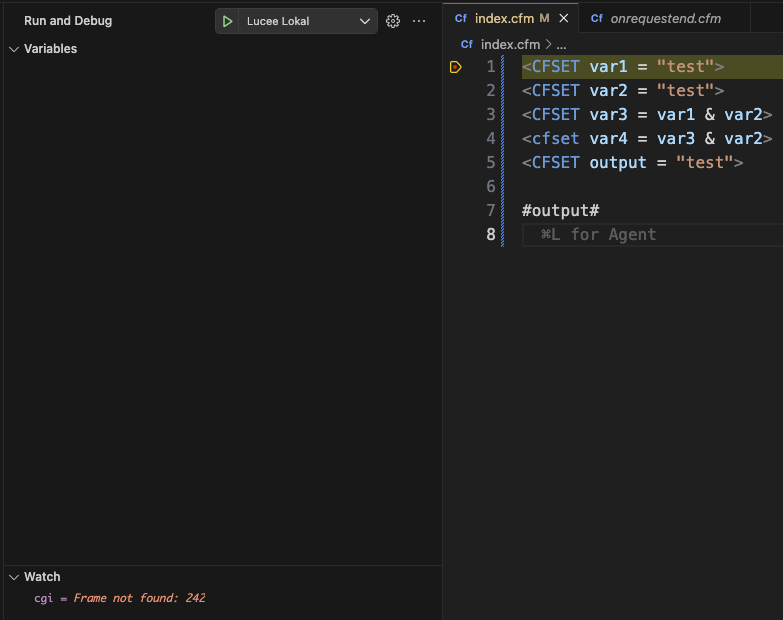
Sometimes there is a “Frame not found: 235” or other line in the watch-area, when the Variables disappear.
I updated lucee to .133-SNAPSHOT and the extension to .7-SNAPSHOT and now I cannot set any breakpoints.
Breakpoints luceedebug has:


Path transforms:
  [4x Path mapping skipped]

Files luceedebug knows about (all filenames are as the server sees them, and match against breakpoint 'server' paths):
[luceedebug] luceedebug 3.0.0.7-SNAPSHOT connected to Lucee 7.1.0.133-SNAPSHOT
[luceedebug] Path mapping: IDE=...
[luceedebug] Path mapping: IDE=...
[luceedebug] Path mapping: IDE=...
[luceedebug] Path mapping: IDE=...
[luceedebug] Exception breakpoints: none
(once:)

[luceedebug] java.lang.OutOfMemoryError: Java heap space
  at unknown
[luceedebug] java.lang.OutOfMemoryError: Java heap space
  at unknown
If I request a (missing) page:
[luceedebug] missinginclude: Page [/foobar.cfm] [/home/xyz/foobar.cfm] not found
  at ...
[luceedebug] expression: Page request is aborted
What details do you need to debug?
If I type anything in the debugConsole, there is a “missing frameID”
[luceedebug] luceedebug 3.0.0.7-SNAPSHOT connected to Lucee 7.1.0.133-SNAPSHOT
[luceedebug] Path mapping: IDE=...
[luceedebug] DEBUG: createTemporaryPageContext failed: null
[luceedebug] DEBUG: getExecutableLines: no PageContext available
[luceedebug] DEBUG: createTemporaryPageContext failed: null
[luceedebug] DEBUG: getExecutableLines: no PageContext available
[luceedebug] DEBUG: createTemporaryPageContext failed: null
[luceedebug] DEBUG: getExecutableLines: no PageContext available
[luceedebug] DEBUG: setFunctionBreakpoints: 0 breakpoints
[luceedebug] DEBUG: Function breakpoints cleared
[luceedebug] DEBUG: setExceptionBreakpoints: filters=[]
[luceedebug] Exception breakpoints: none
[luceedebug] DEBUG: Thread listing: 1 threads
[luceedebug] DEBUG: createTemporaryPageContext failed: null
[luceedebug] DEBUG: getExecutableLines: no PageContext available
I added the debug flag to docker and rebuild docker with the Version .133 & luceedebug 3.0.0.7 and now it works again. “Step over” works too.
I will test it today, but I guess there will be no more issues from my side.
Thank you very much, I really appreciate this tool.