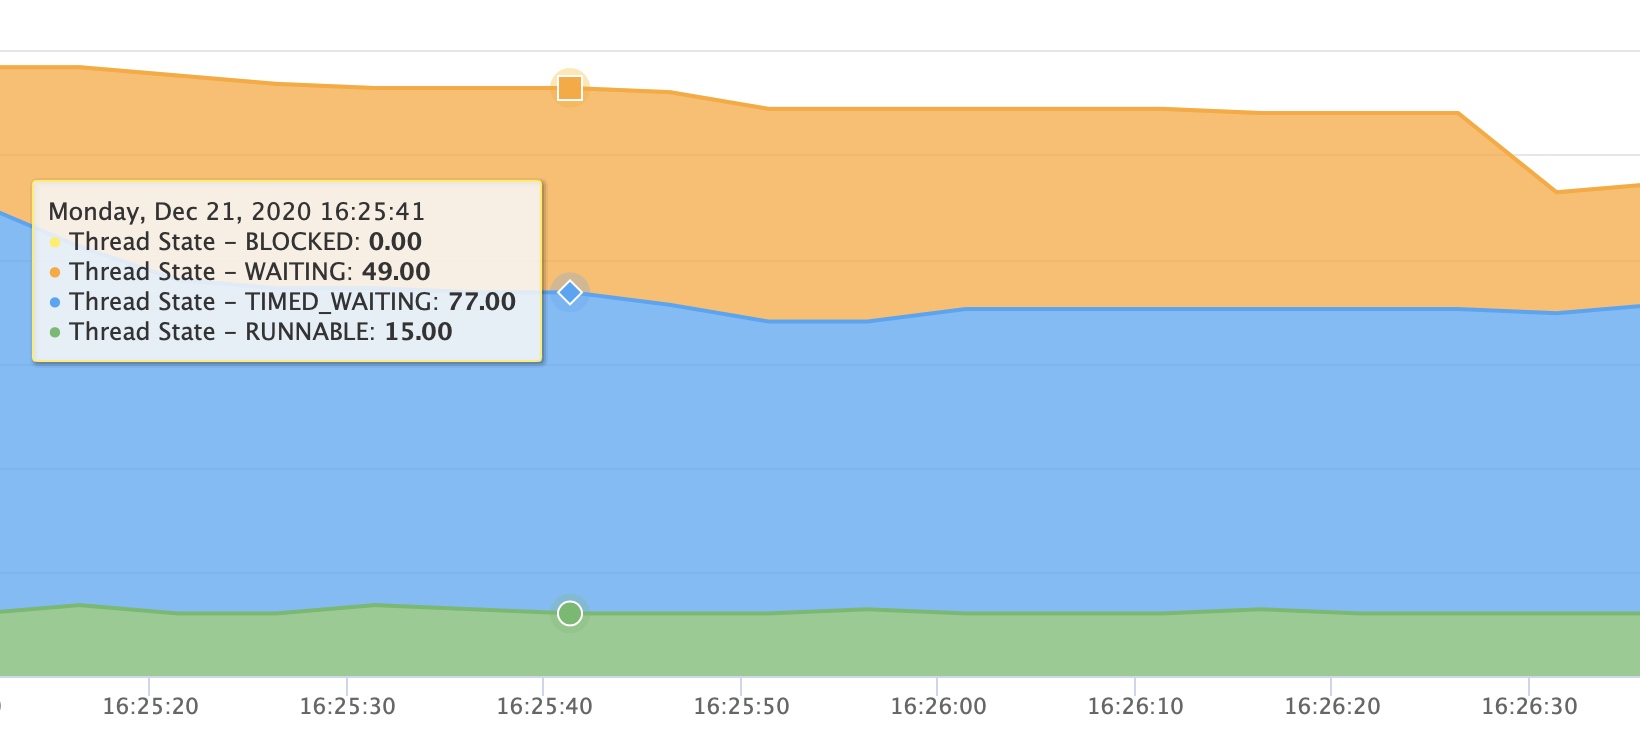
Where can I increase this 15 ‘Runnable’ threads? My CPUs are low (10%), but continually having requests taking 1-3 seconds, all that seem to be in Waiting/Timed_Waiting per FusionReactor.
@rd444 What exactly are the requests waiting for? Is there a thread limit that’s slowing them down, or are the threads waiting on something like a DB call. Start by looking at the details of a slow web request. Check the JDBC tab, the Relations tab, and the Profiler tab to see what the threads are doing.
Interesting-- so that’s not even reaching Lucee yet. Check the maxThreads of the HTTP listener threads in your Tomcat server.xml I believe. It defaults to 200 however, not 15.
Does this happen right away or after the server has been online for a while? There have been some specific scenarios where servers that kill off a lot of requests with the request timeout would slowly zombie all the tomcat HTTP connector threads, not sure if this is affecting you or not.
There’s no maxThreads setting in there. I tried adding one, and restarting but it went back to 15 pretty quickly. It looks like when it first starts it gets as high as 30, but within about a minute it’s back to that 15 number. Not seeing any weird timeouts in any logs (Lucee, apache, mysql)
Do you know how many requests are being sent to the web server? How many running requests does FR show?
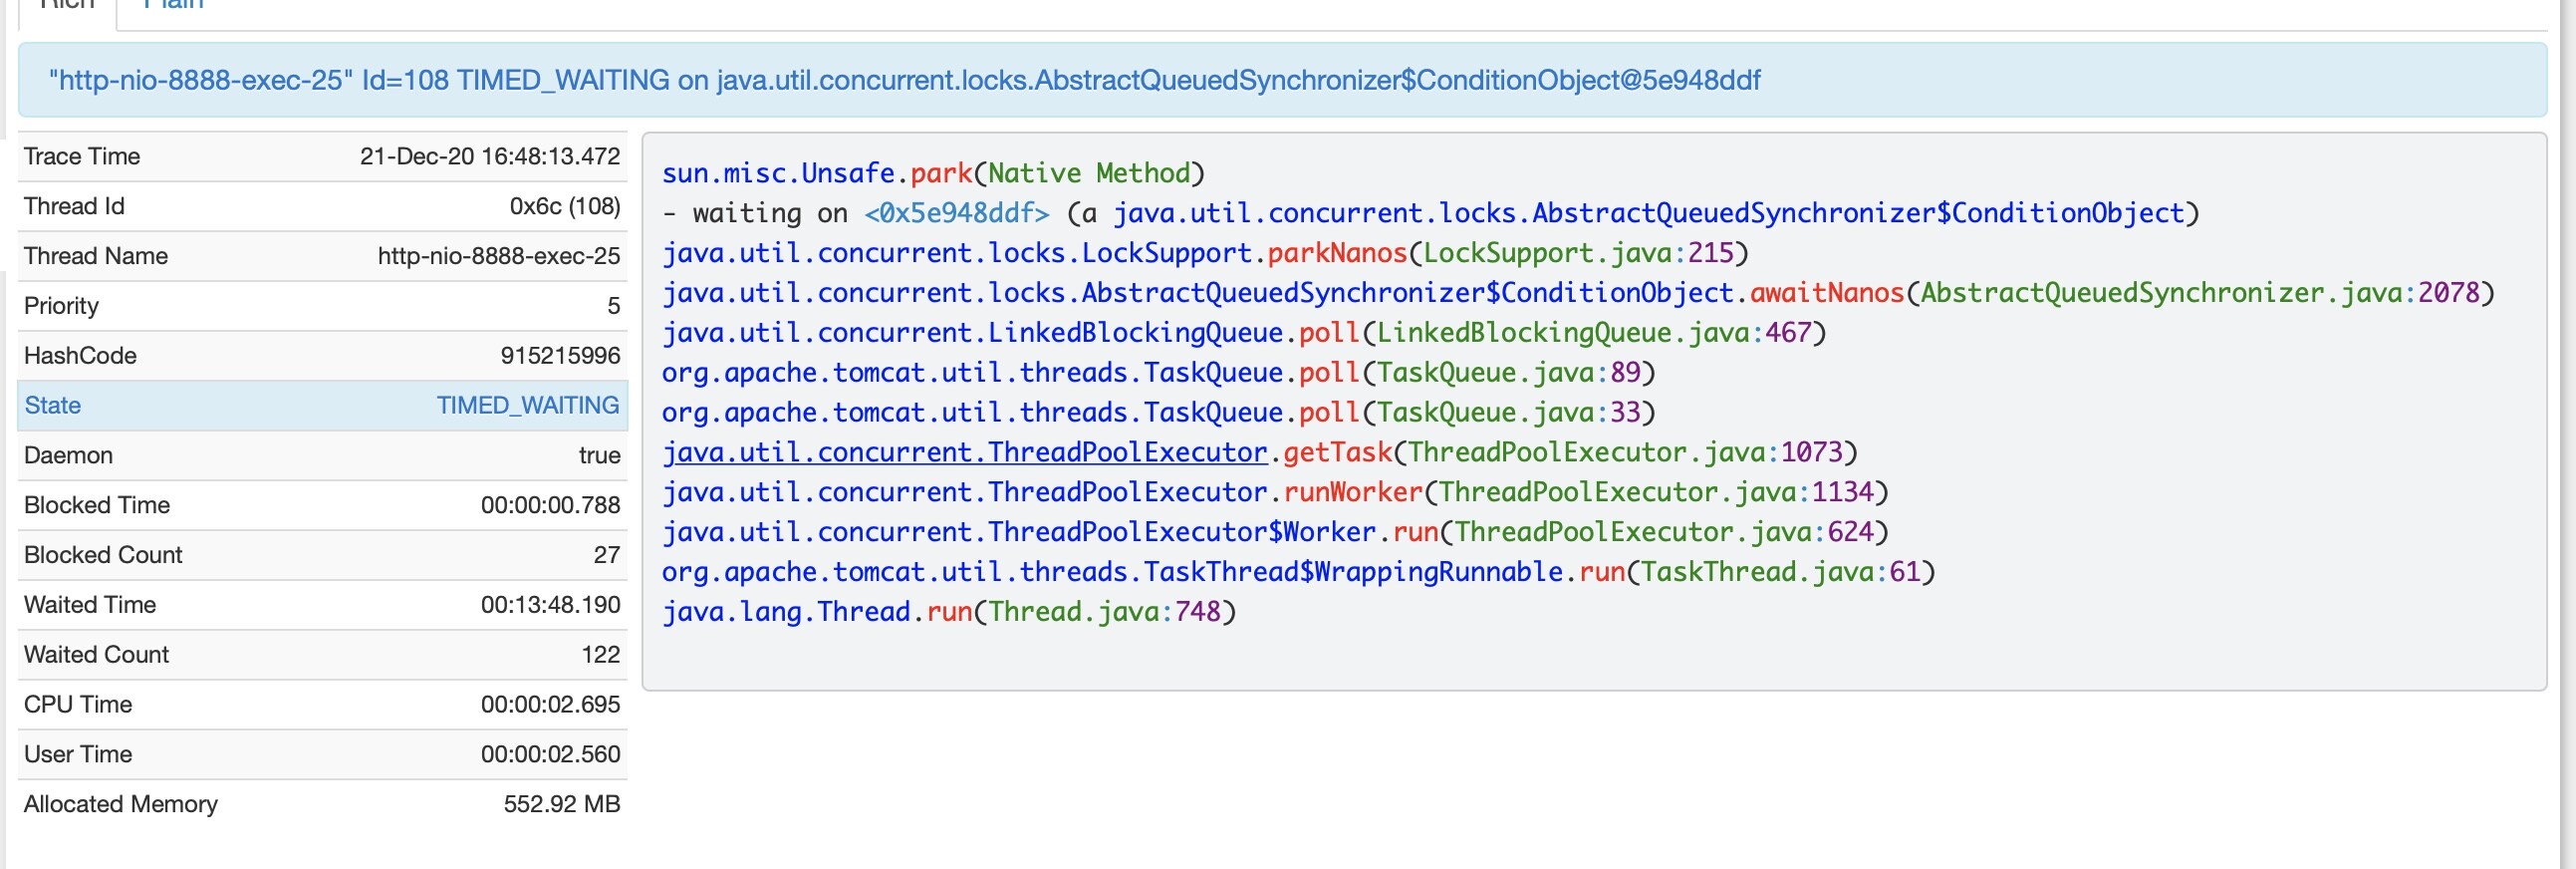
I’m a little confused if the stack trace you show above is actually a running HTTP request, or if you just grabbed a random thread that was parked in the queue not doing anything.
Here’s a list of things that I’m NOT confused by. Ok, I’m done.
The stack trace is from a page that took longer to load than it should have… the symptom is a load time of 1-4 seconds (up from 100-300 ms), seemingly random and the stack traces for those slow requests are always the same.
There’s been 22k requests in the last 90 minutes. I made one change 90 minutes ago that seems to have helped, which was adding maxConnections=“200” to server.xml
The thread state graph hasn’t changed (still shows 15 running, 39 waiting, 43 timed waiting)
But, there’s only been 1 request longer than 1 second in the last 90 minutes (and that’s just a slow query).