Lucee 7 + Win 2022 + IIS + BonCode = 502 errors after idle

The Problem (simplified):
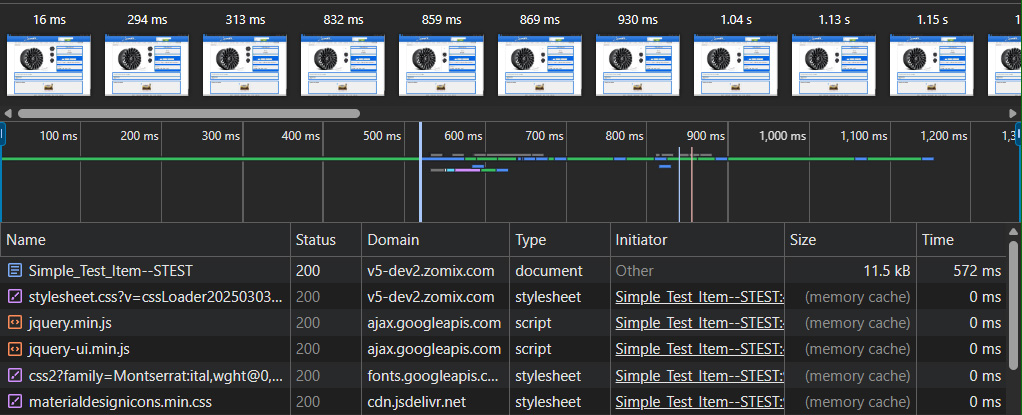
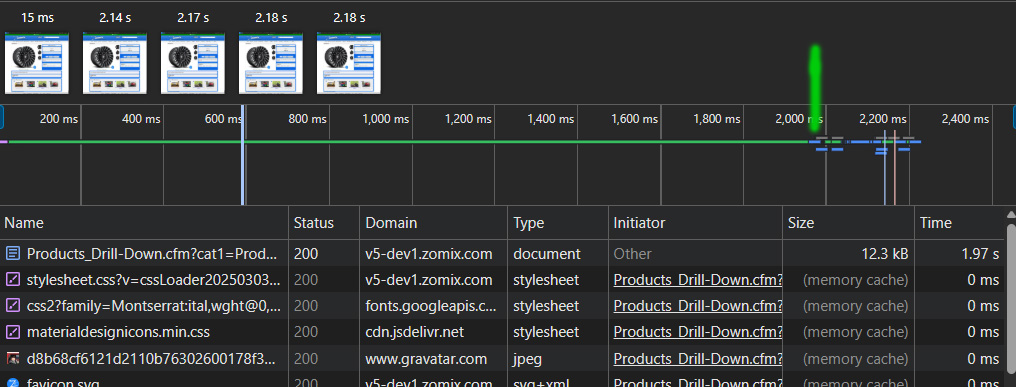
Hit a site page (simple home page, doesn’t matter, .cfm) wait 60 seconds and then do a refresh, result is a 502 error. 2nd refresh loads the page fine.
Some of the settings i tried (tweaking some of the timeouts) would change the results the refresh @ 60 seconds resulting in a ‘timeout’ from iis/.net. If I waited long enought -before- the first refresh in that config state, (like 120+ seconds) I would also get a 502.

I’ve been fighting this for several days now. I’ve tried just about every combination of timeouts/pools/TCP settings in server.xml, boncodeAJP13.settings, IIS that I’ve been able to fin references to to solve this problem.

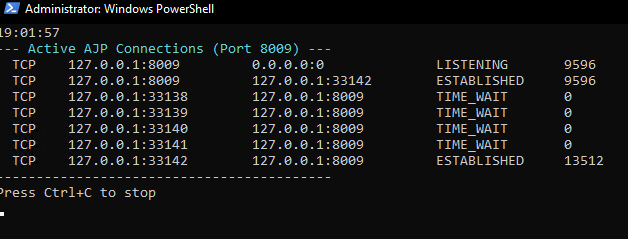
I have a active AJP Connections Diagnostics window open showing me the connections. I can see the connection go from ‘Established’ to “Close_Wait” and “Fin_Wait_2”. But those will stay in the list for another 60+ seconds before dropping. If i refresh while those are still listed, is when i get the ‘hang’ of the iis/.net timeout. If i wait til they drop then I instantly get a 502.

I understand that this sounds like a timing issue. But nothing I’ve tried (or that’s been suggested to me) has worked.

I’ve tried all the different combinations of ip addresses (::1,127.0.0.1,0.0.0.0) none of which fixed the issue.

I’ve attempted with and without the secrets, updated the TCP, changed iis settings, the list of attempted changes is huge.
I don’t understand why it’s so hard to get a fresh windows 22 installation with a fresh Lucee 7 install to work without these errors.

The Attached txt is one of the combinations I’ve used.

127.0.0.1 8009 25 True True False False <RequestSecret{secret} {modsecret} 2000 16384 16384 True False False 30000 30 True 3 C:\BonCodeLogs

BonCode Log (tail end of the initial ‘good request’) followed by the error after attempting a refresh of the same page.

2026-03-18 13:14:26 BonCodeAJP13.TomcatPackets.TomcatSendBodyChunk 16380 bytes
2026-03-18 13:14:26 BonCodeAJP13.TomcatPackets.TomcatSendBodyChunk 2553 bytes
2026-03-18 13:14:26 BonCodeAJP13.TomcatPackets.TomcatSendBodyChunk 4 bytes
2026-03-18 13:14:26 BonCodeAJP13.TomcatPackets.TomcatSendBodyChunk 12663 bytes
2026-03-18 13:14:26 BonCodeAJP13.TomcatPackets.TomcatSendBodyChunk 4 bytes
2026-03-18 13:14:26 BonCodeAJP13.TomcatPackets.TomcatEndResponse 2 bytes
2026-03-18 13:21:41 Closing Connection ID: 1 [T-2]
2026-03-18 13:21:41 Closing Connection ID: 5 [T-2]
2026-03-18 13:21:41 Closing Connection ID: 3 [T-2]
2026-03-18 13:21:41 Closing Connection ID: 2 [T-2]
2026-03-18 13:21:41 Closing Connection ID: 4 [T-2]
2026-03-18 13:29:07 New Connection 1 of 2000 to tomcat: 127.0.0.1:8009 ID: 1 [T-201]
2026-03-18 13:29:07 1.0.44 ERROR
TCP Client level – Server/Port:127.0.0.1/8009
Unable to write data to the transport connection: An established connection was aborted by the software in your host machine.
at System.Net.Sockets.NetworkStream.Write(Byte buffer, Int32 offset, Int32 size)
at BonCodeAJP13.BonCodeAJP13ServerConnection.ComunicateWithTomcat()
at BonCodeAJP13.BonCodeAJP13ServerConnection.HandleConnection()
at BonCodeAJP13.BonCodeAJP13ServerConnection.p_CreateConnection(BonCodeAJP13PacketCollection packetsToSend)
2026-03-18 13:31:06 New Connection 2 of 2000 to tomcat: 127.0.0.1:8009 ID: 2 [T-230]
2026-03-18 13:31:06 BonCodeAJP13.ServerPackets.BonCodeAJP13ForwardRequest GET /Products_Drill-Down.cfm 3891 bytes

ANY guidance would be wonderful from anyone. I’ve pretty much exhausted everything I can think of and everything ive found online to solve this issue.

Don’t forget to tell us about your stack!

OS: Windows 2022
Java Version: 21
Tomcat Version: 11
Lucee Version: 7

-Dennis
Config Files.txt (1.3 KB)

Looking at your config, there are a few things going on here.

maxKeepAliveRequests="1" is the big one

This tells Tomcat to close the AJP connection after every single request. Each closed connection leaves a socket in TIME_WAIT state, and on Windows that socket is tied up for 240 seconds (4 minutes) before it can be recycled. The default Windows ephemeral port range is only ~16k ports, so under any real traffic you’ll quickly exhaust available sockets on localhost:8009. That’s where the 502s are coming from — BonCode tries to connect, there are no sockets available, the connection fails.

Remove maxKeepAliveRequests="1" entirely, or set it to -1 (unlimited). AJP connections between BonCode and Tomcat on localhost should be long-lived — there’s no reason to tear them down after every request.

Short timeouts + no connection pooling

Your connectionTimeout="30000" and keepAliveTimeout="30000" mean Tomcat closes idle AJP connections after just 30 seconds. Combined with EnablePool=False and TCPKeepAlive=False on the BonCode side, there’s nothing keeping these connections alive or detecting when they die. BonCode sends a request down a socket Tomcat already closed → 502.

Recommendation: strip it back first

It looks like a lot of settings have been added while troubleshooting. I’d suggest starting from a minimal config to get a clean baseline, then add things back one at a time if you actually need them.

Minimal server.xml:

<Connector protocol="AJP/1.3"
    address="127.0.0.1"
    port="8009"
    secret="{secret}"
    secretRequired="true"
    connectionTimeout="120000"
    redirectPort="8443" />

Minimal BonCodeAJP13.settings:

<Settings>
    <Server>127.0.0.1</Server>
    <Port>8009</Port>
    <RequestSecret>{secret}</RequestSecret>
    <EnablePool>True</EnablePool>
    <TCPKeepAlive>True</TCPKeepAlive>
    <LogLevel>1</LogLevel>
    <LogDir>C:\BonCodeLogs</LogDir>
</Settings>

The 120-second connectionTimeout matches IIS’s default 2-minute idle timeout, so IIS will always close connections before Tomcat does. Connection pooling and TCP keepalives on the BonCode side keep connections alive and detect dead sockets.

If you need to keep your existing config

Here’s a corrected version — the key changes are maxKeepAliveRequests="-1", bumped timeouts to 120s, and pool/keepalive enabled on the BonCode side:

Tweaked server.xml:

<Connector protocol="AJP/1.3"
    address="127.0.0.1"
    port="8009"
    secret="{secret}"
    tomcatAuthentication="false"
    secretRequired="true"
    packetSize="16384"
    maxThreads="2000"
    minSpareThreads="100"
    maxConnections="2500"
    acceptCount="2000"
    connectionTimeout="120000"
    keepAliveTimeout="120000"
    maxKeepAliveRequests="-1"
    allowedRequestAttributesPattern=".*"
    URIEncoding="UTF-8"
    redirectPort="8443" />

Tweaked BonCodeAJP13.settings:

<Settings>
    <Server>127.0.0.1</Server>
    <Port>8009</Port>
    <RequestSecret>{secret}</RequestSecret>
    <ModCFMLSecret>{modsecret}</ModCFMLSecret>
    <MaxConnections>2000</MaxConnections>
    <PacketSize>16384</PacketSize>
    <MaxPacketSize>16384</MaxPacketSize>
    <EnableHeaderDataSupport>True</EnableHeaderDataSupport>
    <EnablePool>True</EnablePool>
    <TCPNoDelay>True</TCPNoDelay>
    <TCPKeepAlive>True</TCPKeepAlive>
    <EnableRemoteAdmin>True</EnableRemoteAdmin>
    <LogLevel>1</LogLevel>
    <LogDir>C:\BonCodeLogs</LogDir>
</Settings>

See the BonCode docs for the full list of settings.

We actually fixed the missing connectionTimeout in the installer defaults back in 2019 (viviotech/lucee-installer#98) but the fix was lost when the installer repo was rewritten. Filed as LDEV-6163 to get it added back.

Thanks so much for the input.
I did discover that the keepAlivetimeout =“-1” seemed to solve the 502/timeout issues with the config i had, but i do agree it’s gotten away from me in all the testing.
I will try to go back to square 1 and see how things go.

On a side note, (we’ll see if this is still the case when i do the reset) but I’m seeing a huge inital ‘lag’ or ‘wait’ when i request a page that needs to create a image with cfimage. The cfimage code runs fine on it’s own, at around 180-200ms. But the inital lag i see is anywhere from 3-4 seconds before iis start spouting out content. (kinda like the 2s issue when running weird 127.0.0.1 vs ::1 addresses for the connectors.) I’ll report back if that’s still a issue (it is atm but i need to clean up the configs so stay tuned)

Again, thanks for the input, hopefully I can get this sorted out. I’d like to migrate my Lucee 6 server to this new box asap.

-Dennis

glad i could help!

only on pages using cfimage??? that’s strange… can you share some code?

So first off, I look to be running solid with this config.

<Connector protocol="AJP/1.3"
           address="127.0.0.1"
           port="8009"          		   
		   secret="{secret}"
           secretRequired="True"
           connectionTimeout="120000"
		   URIEncoding="UTF-8"
           redirectPort="8443" />
<Settings>
<Server>127.0.0.1</Server>
<Port>8009</Port>
<EnableHeaderDataSupport>True</EnableHeaderDataSupport>
<RequestSecret>{secret}</RequestSecret>
<ModCFMLSecret>{modsecret}</ModCFMLSecret>
<EnablePool>True</EnablePool>
<TCPKeepAlive>True</TCPKeepAlive>
<LogLevel>1</LogLevel>
<LogDir>C:\BonCodeLogs</LogDir>
</Settings>

Doing tests with this config seems solid. My Active AJP Connections seem to be more in line with what I would expect. And no 502’s have poped up.

So on the cfimage deal, yea it’s only on pages that use cfimage (in tag form or script, doesn’t seem to matter) The image script runs fast, i can stick in a tickcounter and it’ll run in less than 200ms usually. simple resize of a image if that ‘size’ doesn’t exist, so it does do a if fileexists. Server is fast with SSD NVMe drives so it’s not a io issue. I have this exact code running on our live server running Lucee 6 (and cfimage 2.x) and in network status in the browser debug, the ‘page’ renders in about 600ms total including creating the image. On the Lucee 7 / cfimage 3.0.1 server it takes almost 2seconds to render the page. Even tho the image processing only took 220ms.
This is some stripped down logic on the imge create. its basic

<cfscript>
		tick = getTickCount();
			
			// 1. READ the image
			objLargeImage = ImageRead("#application.FULLPATH##attributes.path#\#attributes.src#");
		read = getTickCount();
			// 2. RESIZE Logic
			if ((w < objLargeImage.width || h < objLargeImage.height) ) {
			    
			    // Use the variable imgQuality (highestPerformance / highPerformance)
			    ImageScaleToFit(objLargeImage, w, h, 'highPerformance');
			    
			    niw = objLargeImage.width;
			    nih = objLargeImage.height;
			    
			    if (debug) {
			        writeOutput("<div>New Image Size is: #niw# x #nih#</div>");
			    }
			}

			// 3. STRIP METADATA (The Canvas Transfer)
			// Create a new blank canvas and paste the processed image onto it
			objImage = ImageNew("", objLargeImage.width, objLargeImage.height, "rgb");
			ImagePaste(objImage, objLargeImage, 0, 0);

			// 4. WRITE the image
			// Using "WEBP" in uppercase to ensure Lucee 7 Extension 3.0 recognizes the codec
			ImageWrite(
			    objImage, 
			    "#application.FULLPATH##attributes.cachepath#\#w##h##c##attributes.rotate##attributes.pad##addWater##attributes.src#", 
			    0.9, 
			    true,
			    true
			    
			);
			// objImage.getBufferedImage().flush();
			// objImage.getGraphics().dispose();
			done = getTickCount();
			writeOutput("<div>Read Time: #read-tick#ms</div>");
			writeOutput("<div>write Time: #done-read#ms</div>");
			writeOutput("<div>Total Time: #done-tick#ms</div>");

		</cfscript>

So for reference I did have this running fast on the lucee 7 /cfi 3 server but in doing so i created the 502 issue in the process. and to be honest i’ve done soe many config changes over the last 2 days i couldn’t tell you at this point what the smoking gun was on getting that to go. I think it was something with the pools and the flush but at this point i need to try some of those again and see if it corrects it. But any guidance on that would be awesome. We use this method of ‘is there a temp image of the size we need available? if not create a temp image’ a ton in our cms. so its important to get this sorted so we dont have this delay when that occurs.

Meant to upload these showing that inital ‘warm-up’ for each. In both cases I’m forcing it to create the one large image.


I’d be adding some detailed logging to figure out what’s going on.

@Dennis_Racine FYI, did a code review and found a related bug

Thanks for the update. I’ve update the boncode files, and I’m still seeing this TTFB issue when cfimage. Not sure where to go from here. I’ve run a ton of different tests and variations. Keeping in mind that my code worked great on lucee7/cfimage 2.x … I have tried putting the write in a thread, getting rid of the write all together and just writing direct to the browser, simplifying most the code to just the basics of ‘read’ and ImageScaleToFit. Switched to cfscript vs tag based. About everything i could think of to over come the issue. The TTFB usually sits at around 500ms to 2s. If i have 3+ calls on the page it’ll jump to 30seconds.

From what I’ve read it sounds like some issue with cfimage not sending a end of data to iis, and therefore iis sits there for a time before it decides to write what it has.

I’ve tried messing with the AJP and bonCode configs to try and get the TTFB down, but seems like everything either doesn’t do anything to help or messes with general normal page loading. Now it’s possible I havn’t found the ‘magic’ combination, but as you saw in my original config i had all kinds of crazy stuff in there trying to get things to go :slight_smile:

So things I’ve tried: messing with TCPNoDelay, TCPKeepAlive, ForceRequestLogoff, FlushOnRequestEnd, FlushThreshold, PacketSize, SecretRequired

Granted if the solution is in there maybe i never hit the right combination.

I back to running a pretty basic config. I has some issues with the ‘optimized’ config you suggested, altho I’ll have apply it again to tell ya what it wasn’t happy with, but i know it didn’t solve this issue.

You can see the issue in realtime here:

changing the refresh=true to false will load the image without cfimage touching it.
for this page, we’re looking at ~2s TTFB with true vs ~100ms

Also for reference
Screenshot 2026-03-19 190204

<Connector protocol="AJP/1.3"
           address="127.0.0.1"
           port="8009"          		   
		   secret="{secret}"
           secretRequired="True"
           connectionTimeout="120000"
		   URIEncoding="UTF-8"		   
           redirectPort="8443" />
		   
<Valve className="mod_cfml.core"
		loggingEnabled="false"
		maxContexts="200"
		timeBetweenContexts="2000"
		scanClassPaths="false"                
		sharedKey="{modSecret}"
		/> 
<Settings>
<Server>127.0.0.1</Server>
<Port>8009</Port>
<EnableHeaderDataSupport>True</EnableHeaderDataSupport>
<RequestSecret>{secret}</RequestSecret>
<ModCFMLSecret>{modSecret}</ModCFMLSecret>

<EnablePool>True</EnablePool>
<TCPKeepAlive>True</TCPKeepAlive>

<LogLevel>2</LogLevel>
<LogDir>C:\BonCodeLogs</LogDir>
</Settings>

Sorry if i’m being a pia, just need to get this sorted. :slightly_smiling_face:

-Dennis

mate, this very hard to follow.

don’t worry about script vs tags, that’s not the problem, a red herring

strip it all back, so with a simple page, in a folder with a basically empty Application.cfc

index.cfm

s = getTickCount();
// do a cfimage thing
echo( getTickCount() -s);

you’re seeing a vastly different response time in dev tools to execution time?

Zackster,

Right, so here we go, a couple of quick little templates in the most basic form. (Application.cfc is basically blank)

https://v5-dev1.zomix.com/test/imgtest.cfm

So I’m seeing ~150-185ms total execution of lucee templates and cfimage
I’m seeing a TTFB at 287ms for a total of around 325ms in this case (this is small margins in this case but increase the more the tag is used)

In this test case, ,with multiple image reads of the same image the TTFB is over 600ms
https://v5-dev1.zomix.com/test/imgtest2.cfm

and for final reference here is the same page with no cfimage script to show the normal TTFB

https://v5-dev1.zomix.com/test/imgtest0.cfm

-Dennis

hmm, same with cfcontent and a static image?

What about directly on port 8888?

cfcontent:
https://v5-dev1.zomix.com/test/contenttest.cfm

img src
https://v5-dev1.zomix.com/test/imgteststatic.cfm

Those seem fine, no TTFB issues

on local, 8888 the TTFB matches what ever the template time is. so thats what i would expect. (in these tests 150ms for the single image)

the installer default BonCode config has <FlushThreshold>0</FlushThreshold>

Yea, I’ve tried FlushThreshold. Along with some of the other flush options there. I have put that back in for now.

it feels like when there is just enough overhead/processing time of a cfimage ask that there ends up being a exponential increase in TTFB … I’ve added debug and tickcounters to a few different test pages, and as a good example I have a page that is someone heavy, around ~500ms of processing. that then has a crazy increase of TTFB of 2.5secons … if i run the same page, and ‘skip’ the image processing, and just ‘show’ the image with a img tag, i get a page total processing time of 50ms (because there is no image processing) but more important the document TTFB is around 200ms. (50ms for the page processing, + latency to the server 50ms = 100ms) so we have a mystery 100ms in there somewhere, but at these speeds is unnoticeable and not a big deal unless it’s a indicator of the larger issue when the page processing time goes up.
I did run a couple of tests, just doing a sleep(1000) etc and got expected results in TTFB of the sleep time.
Another interesting note, when turning on debug for the full test page the TTFB takes like 12-13 seconds, while the lucee executing time in debug says 380ms

Do we have an issue with threads/multi-requests not happening and everything is being lined up in a single pipe and going one after another or something? This isn’t really my field of expertise for sure. As all this code runs fast and as expect on our Lucee6/windows2019 server, with a fraction of the memory this new server has, (18 vs 64gb) Not sure if windows 2022 has anything to do with anything, but it’s still iis10 in both cases.

I’m not defining packet sizes or anything, altho i have tried that here and there in the testing earlier, but we never set that on our current live server either.

I know that i had this issue ‘masked’ where the pages would appear to load faster 9as expected) but that’s also when i was getting the 502’s so obviously that wasn’t ‘the setup’ to use. At this point I’m not even sure what that config was. :confused:

Hoping you have some ideas.
Thanks SO MUCH for you help and input on this!
-Dennis

ok so i’ve head a break through. I’ll continue to test tonight to make sure we didn’t create some other issue, but we’re looking WAY better.

BTW for reference our current server (that this new one is to replace) has about 100 sites, of which a few are very high traffic with a lot going on. ie. performanceplustire.com has crazy queries going on.

So the thing that seems to have done the trick was adding flushPackets=“true” to the server.xml.

Here r my current configs.

<Connector protocol="AJP/1.3"
           address="127.0.0.1"
           port="8009"          		   
		   secret="{secret}"
           secretRequired="True"
           connectionTimeout="120000"
			flushPackets="true"
		   URIEncoding="UTF-8"		   
           redirectPort="8443" />

BonCodeAJP13.settings

<Settings>
<Server>127.0.0.1</Server>
<Port>8009</Port>
<EnableHeaderDataSupport>True</EnableHeaderDataSupport>
<RequestSecret>{secret}</RequestSecret>
<ModCFMLSecret>{modsecret}</ModCFMLSecret>

<EnablePool>True</EnablePool>
<TCPKeepAlive>True</TCPKeepAlive>
<FlushThreshold>0</FlushThreshold>
<FlushOnRequestEnd>True</FlushOnRequestEnd>

<LogLevel>0</LogLevel>
<LogDir>C:\BonCodeLogs</LogDir>
</Settings>

I will provide a update later tonight either way after our testing.

-Dennis

2 Likes

Looking good. Still doing a bunch testing but so far so good! Thanks so much for you help!!

-Dennis

Glad we figured it out, please support my work here if you can, thanks if you’re already a supporter!