Lucee 6.2.0.321 memory issues? - pagePoolClear()

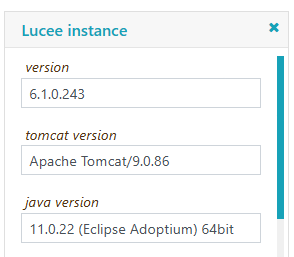
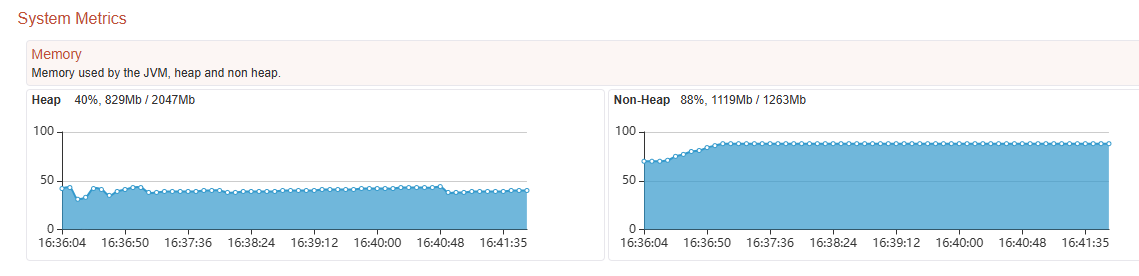
Hi, we’re experiencing some memory issues on our DEV-server. It was a fresh install from a Lucee 6 stable release, with the 5.4.x JAR as a base loader. I then upgraded to 6.2.0.321 and replaced the 5.4.x. JAR to the 6.0.1.83 JAR, as we have that on our LIVE server as well. Since then the memory continually grows during the week, with some development going on. On a Friday it usually is ok, but come Monday morning Tomcat no longer is present at the designated port, giving an error in the browser saying nothing is listening. The memory of the Windows service has then grown to 4,5GB, whilest it ususally runs on 1GB. The Windows service is still running, but unresponsive to the browser. Nothing is done in the weekend, no work on the server and there are only some scheduled tasks that run on a timely basis. What could be the culprit? For now I’ve downgraded to 6.1.0.243, as I read somewhere that others had issues with the version in between, 6.1.1.118 (also in relation to scheduled tasks?).

Stack:
Windows 2022
image

Firstly, if you are upgrading the loader, I’d recommend using using the 6.2.0.321 loader, otherwise, you’re just battling tech debt for no good reason. (same goes for using the Final 6.2.1 RC!)

Seems interesting that it this is growing over the weekend, is the dev server internet facing? Is debugging enabled?

The first thing I’d be doing is checking the logs (webserver, tomcat, lucee), if the server goes down, there should be some clues time wise, i.e. when do the logs stop over the weekend, which may point to which requests are causing the problem?

Also on the admin overview page, what do your scopes look like?

Java Tooling

Java has some really nice tooling to investigate and track memory usage, both via heap dumps and monitoring.

JMC is great and let’s you attach to a running java instance

Heap dumps

jmap and jcmd let you capture a heap dump from the command line

https://www.baeldung.com/java-heap-dump-capture

There’s also an admin extension to generate a heap dump

https://download.lucee.org/#25BB800E-A621-4AF1-B2442EB9F56D93E3

Once you have a memory dump in either JMC or MAT and see what the large objects are hanging around.

Java Flight Recording

The other option is with JFR, java flight recording, which is a low overhead monitor which can be used even in production so see what’s going on in real time.

1 Like

Thnx, I’ll try out the above and keep monitoring it.

During testing I have downgraded to several older versions, but all of them failed the JDBC-connection to our databases. No matter which version I used below 6.2.0.321 they alle failed in the same manner.

So I’m back on 6.2.0.321 now and have also changed the JAR-loader to the latest version (tried that before I read your answer here :slight_smile: - even though I read somewhere that the loader is not looked at anymore since 6.2? Or did I read that wrong here: Lucee 5.4 to 6.2 Upgrade Guide, Tomcat 9 to Tomcat 11).

Will have a look at logging etc. during this week and also the scopes, to see what might be causing this. The scopes do not look worrisome at the moment, but maybe during the week it will worsen. I’ll take the time and see. garbage collection looks like it working well if I view the real-time monitoring in the Admin. Thnx 4 the tips so far!

@Zackster off-topic: which version of Java and Tomcat does a fresh 6.2 install come with? Java 11 and Tomcat 9.x still or some other versions?

Only the restriction on running older versions on a new loader has been removed

It’s really high time to forget about 6.2.0, the 6.2.1 final RC is what you should be using, it’s mainly a bug fix release, addressing quite a few regressions in 6.2, otherwise, you’re just risking wasting time battling tech debt

Lucee 6.2.1 bundles Tomcat 11 and Java 21.

6.2.0 came with Tomcat 10.1 as Tomcat 11 wasn’t released until late in our RC cycle.

what jdbc drivers are you using and what was the fail in the same manner? a stacktrace would be great, especially as it will help anyone else googling the same problem!

GC is JVM managed in 6.2, previously it was forced every 5 mins which ain’t needed.

OK, so your answer tells me that our LIVE server running 6.1.0.83 needs a full reinstall as well then :wink: I foresee a weekend of hard work so all users can enjoy the new stuff the Monday after.

I will make the change to 6.2.1 then, even though it’s a RC, but for DEV that is manageable and admissable. Upgrading from an RC to a stable release I assume is rather painless? We are not in a different release funnel because we have an RC in use?

Upgrading Tomcat and Java at the same time will be a big plus.

We are using the latest 12.x.x.jre11 drivers for MSSQL. Tried downgrading to the jre8 drivers, all the way to 10.x.x.jre11 and jre8, but to no avail. Our ORM-implementation just kept saying that the database table or the accompanying object didn’t exist :open_mouth: . Combined with any version of Lucee 6 below 6.2.0.321. Upgrading to 6.2.0.321 again fixed the issue instantly, maybe helped by the updated version of the JAR loader.

New GC management in 6.2 will be a new challenge and experience!

Yeah RC to stable is painless, only conservative bug fixes allowed.

Glad everything is working with 6.2 for you!

6.2 is now in a bug fix only phase, you can expect any followup 6.2 releases to be only minor, similar to 6.0.3 and 6.0.4, as 7 is our active development branch now

1 Like

I’ll have to do a reinstall, 'cause all metrics show me that after a series of request the memory just keeps going up. It never goes back down though. So after having a series of say 50 to 70 sequential or parallel requests, the memory in Windows just keeps climbing, even after reaching the maxValue set in the JVM settings. The non-hap memory isn’t cleared and the heap memory GC isn’t working either it seems, or only in small amounts. Only remedy is to forcefully restart the Windows Lucee service and then the memory is cleared. But that is of course not manageable on a LIVE system. So this weekend I’ll have to do a clean install of our DEV-server and hope that will remedy the situation :open_mouth: :frowning: .

All the webapps are FW/1 run btw.

hmmm, want to do a heap dump and share a link to it via email / dm?

1 Like

Sure, how do I do this? :wink: That’s my level of knowledge in that area :slight_smile:

Ah, ok, I’ll try your tips from up top first!

Feels a bit like this unresolved issue: Non-heap memory, metaspace climbs until system is fully unresponsive - #10 by gooutside
That thread just died in January of last year, but unsatisfactory…, hoepfully they got it resolved, but wondering what the cause was.

easiest way is to just install the heap dump extension in the admin

it adds a menu item, then you can just run it

and zip up the file produced in that dir, it compresses rather well

1 Like

OK, got it to work now, but even after zip’ing it’s around 220MB. Shall I send it to you via WeTransfer or something? Unzipped it’s almost 850MB.

yeah, just a password on the zip file as well :wink:

Good morning, sebgmc,

It’s funny to see that thread pop back up – there was no resolution, other than needing to up-size my virtual machine instance (more vCPU, more RAM). I didn’t want to have to do that, but, now I spend $20 more per month to avoid the pathological, obsessive-compulsive memory-growing errors.

I’ve had a pretty stable year since moving to a bigger server. I wish there was a better answer to give.

1 Like

I must say, I had this problem on my new Windows 19 Server. The memory just kept going up until the application server stopped responding. It used to stay stable for about 24 hours and then it started to rise after that, with an inevitable crash after about 2 days.
This was with an earlier version of Lucee. I think we are on the highest version of 5x
The only solution we found, in the end, after monitoring the problem with Fusion Reactor, for many months, was to restart the application server ever morning at about 3AM.

Update on this, we did a bit of a deep dive and found the probable cause

https://luceeserver.atlassian.net/browse/LDEV-5491

in dev, pagePoolClear() was being run on every request, which is causing the non heap to grow each time.

We will address it, but not before 6.2.1 is released

PagePoolClear() is generally not recommended these days, if you server is running with inspect templates auto or once, it’s just not needed as Lucee does that automatically.

InspectTemplates() is recommended and is often used in tandem with the setting Inspect Never, which all production servers should use if possible, calling it when you deploy new code / reload the application, depending on how you deploy.

What’s the difference? PagePoolClear() brutally purges the cache, InspectTemplates() is more like a if modified since check aka 304. It only marks the page cache as being dirty, each page (file) it will be checked once after InspectTemplates() is run.

2 Likes

quick example for that ticket, numbers are the non heap size in Mb

the test is running 30k samples of

  • pagePoolClear()
  • creating the Administrator.cfc three times,

using ArrayEach() in parallel.

With PagePoolClear()

6.2.0.321 112MB, 30k cycles  [28,55,83,112,"GC",112]

With InspectTemplates()

6.2.0.321 33MB, 30k cycles  [28,29,29,33,"GC",33]
6.2.1.114-SNAPSHOT 36MB, 300k cycles 	 [27,29,33,36,36,36,36,36,36,36,36,36,36,36,36,36,36,
36,36,36,36,36,36,36,36,36,36,36,36,36,36,"GC",36]

BTW Lucee 5.4 hangs on this test, Lucee 6.2 is way more robust

I’ve updated the Breaking Changes document for 6.2 to reflect this

1 Like