Forgive me as this may be a total newbie question, but here we go:
We are in the process of converting our environments from ColdFusion 16 to the latest Lucee release (5.2.9). We cannot seem to figure out the right combination of settings that will prevent us from getting a java heap space error. We can consistently reproduce the error with only a single user on our testing server. If we click around fast enough and hit a few searches within the app, we can get it to spin for 30 seconds and display the java heap error.
Our current testing server is an AWS m5.xlarge with 8gbs of memory. Java (1.8.0) settings are now back to the default with the exception of:
Initial Memory Pool: 1024
Max Memory Pool: 4096
Thread Stack Size: 1000
I know I will likely get a lot of “it depends” answers, but the fact that I can get a heap error with a single user makes me think its something pretty obvious.
We created a Selenium script that clicks a series of links in the application so we can easily reproduce the error. We just ran at both half and quarter speed and we still get the error about 8 clicks in:
Lucee 5.2.9.31 Error (java.lang.OutOfMemoryError) Message Java heap space Java Stacktrace lucee.runtime.exp.NativeException: Java heap space
Caused by: java.lang.OutOfMemoryError: Java heap space
We did modify the following in setenv.sh and it didnt seem to help:
CATALINA_OPTS=“-Xms1024m -Xmx4096m”;
Modifying an sh file isn’t going to affect how Windows runs What is the effective heap size of the JVM? I believe this number shows up in the Lucee server admin home screen. It’s possible that some very small default size is being used. If the heap is at least a gig or more, then configure the JVM to perform a heap dump on OOM errors. Then you can use a heap inspection tool to see what is taking the space up.
Ok, good to know. Are you using RAM cache or something by chance? You need to find out where all these queries are coming from. Again, generating a heap dump and analyzing it post mortem should give you good info on this.
Can you also clarify where you got those two classes from? I’m not aware of a Fusionreactor feature that gives you that sort of information. I’ve only seen graphs that show you high level percentages of what is used and free.
Inside the Instance Manager in FusionReactor, on the left hand menu under Memory you can view the Heap. Which is giving me what classes are using memory.
And yes, we setup all the caches to be RamCache for Objects/Templates/etc etc.
Don’t ever use Ramcache for anything other than testing. Ever. It basically has no eviction policy so it will just fill up your heap until your server crashes. You can use something like EhCache, but I really recommend a distributed out of process cache. At Ortus, we use our commercial Couchbase extension because Couchbase has unrivaled scaling, failover, and performance, but there’s free extensions for Memcached and others which you can drop in pretty easy.
Also, another option to the built in caches if you really want a pwerful in memory cache is to use CacheBox. It’s a standalone lib (that also bundles with ColdBox MVC) which defaults to using concurrent softreference stores with object limits, customization eviction policies, and JVM memory checks. The only downside is, it would require code changes for you to use it.
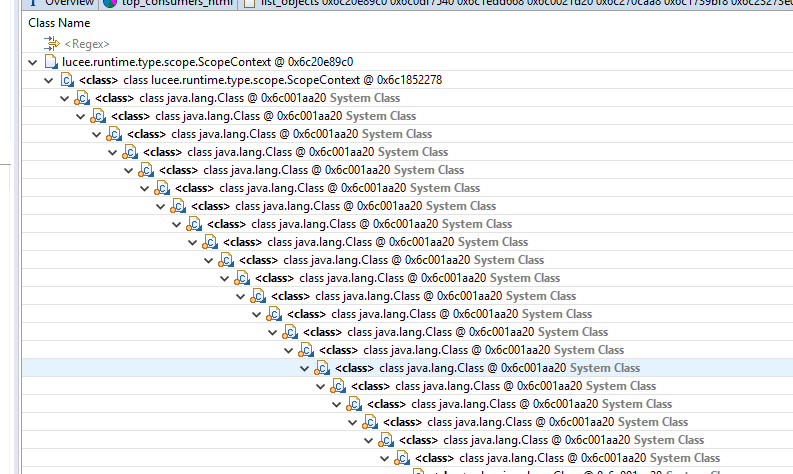
We installed Eclipse Memory Analyzer and loaded up a dump from a recent heap space error we got. We discovered this inside the lucee.runtime.type.scope.ScopeContext:
We use a memcached instance using AWS/ElasticCache, which was easy to setup and has worked well in a clustered environment with heavy load for more than a year. There is a Lucee memcached extension that you need to install. I haven’t found any docs for the memcached extension settings, so I just guessed at what they should be.
@mdriscoll Look at the Hex memory address next to each class instance. It’s the same instance over and over. I think you are just on a red herring and expanding an infinite circular reference which is unrelated to your issue.