@Zackster
To address this issue, I’ve implemented a new log management system using a scheduled task. This task runs at regular intervals and checks whether the log file already exists in Azure. If it does, the task downloads the existing file, appends the new logs, and re-uploads it, overwriting the previous version. Afterward, it deletes the local log file from the Lucee server to ensure that only new data is processed during the next run.
If the log file doesn’t exist in Azure, the task simply uploads the new log file and deletes it locally. Additionally, I’ve added a measure to prevent Lucee’s automatic backup of log files, so the system only handles .log files and manages its own backups. This prevents large files from being transferred during each run and keeps the process efficient.
<cfcomponent>
  <cffunction name="getLogNames" return="array" access="public">
    <cfset local.logNames = directoryList(getLogFilePath(), false, "name", function(fileName) {return arguments.fileName.hasSuffix(".log")})>
    <cfreturn local.logNames>
  </cffunction>

  <cffunction name="getLogFilePath" return="string">
    <cfargument name="fileName" type="string" default="">
    <cfset local.fileName = arguments.fileName.Len() eq 0 ? "" : "/" & arguments.fileName>
    <cfreturn expandPath("#GetDirectoryFromPath(GetCurrentTemplatePath())#../../../../WEB-INF/lucee/logs" & local.fileName) >
  </cffunction>

  <cffunction name="backupAllLogs" access="remote" returnType="string">
    <cfargument name="threadData" type="struct">
    <cfset local.logNames = getLogNames()>
    <cfset arguments.threadData.progressData[0].name = "Logs to backup">
    <cfset arguments.threadData.progressData[0].current = 1>
    <cfset arguments.threadData.progressData[0].total = "#arrayLen(local.logNames)#">

    <cfdump  var="Starting log backup #getLogFilePath()# #arrayLen(local.logNames)#" output="console">
    <cfif arrayLen(local.logNames) gt 0>
      <cfloop array="#local.logNames#" item="local.logName">
        <cfset backupLog(replace(local.logName, ".log", ""))>
        <cfdump  var="Backed up #local.logName#" output="console">
        <cfset arguments.threadData.progressData[0].current++>
        <cfif arguments.threadData.abortThread>
          <cfreturn "aborted">
        </cfif>
      </cfloop>
    </cfif>
    <cfreturn "success">
  </cffunction>

  <cffunction name="backupLog" access="remote">
    <!---  just the file name, no extension  --->
    <cfargument name="logName" type="string">

    <cfset local.logPath = getLogFilePath("#arguments.logName#.log")>

    <!--- if the file doesn't exist do nothing--->
    <cfif !fileExists(local.logPath)>
      <cfreturn>
    </cfif>
    <!--- if the file exists but has no data, do nothing --->
    <cfif fileInfo(local.logPath).size eq 0>
      <cfreturn>
    </cfif>

    <cfset local.blobName = "/logs/#arguments.logName#.log">
    <cfset local.blobLogName = "#arguments.logName#-blob.log">
    <cfset local.blobLogPath = getLogFilePath(local.blobLogName)>
    <cfset local.blobExists = application.BlobStorageUtilities.blobExists(local.blobName)>

    <cfif local.blobExists>
      <cfset local.blobLogs = application.BlobStorageUtilities.downloadBlob(local.blobName, local.blobLogPath)>

      <cfset fileAppend(local.blobLogPath, fileRead(local.logPath))>

      <!---   if the file is over the lucee log file limit (-1000 bytes to prevent lucee going over and auto renaming the file)      --->
      <cfif getFileInfo(local.blobLogPath).size gt 9999000>
				<cfset local.archiveBlobLogFilename = application.utilities.makeUniqueBlobFilename("/logs", "#arguments.logName#.log")>
        <cfset application.BlobStorageUtilities.uploadBlob("/logs/#local.archiveBlobLogFilename#", local.blobLogPath)>
        <cfset application.BlobStorageUtilities.deleteBlob(local.blobName)>
      <cfelse>
        <cfset application.BlobStorageUtilities.uploadBlob(local.blobName, local.blobLogPath)>
      </cfif>

      <cfset fileDelete(local.blobLogPath)>
      <cfset fileDelete(local.logPath)>
    <cfelse>
      <cfset application.BlobStorageUtilities.uploadBlob(local.blobName, local.logPath)>
      <cfset fileDelete(local.logPath)>
    </cfif>
  </cffunction>
</cfcomponent>
The current issue I’m facing is that Lucee or possibly the underlying Java process is holding onto the log files, which causes errors when I attempt to delete them (error output below). I suspect this is related to the garbage collector not flushing file I/O properly after reading the files.
To address this, I’ve tried several approaches. One approach was to wait until all uploads are complete before deleting the files in a separate loop after backupLog is called. I also switched from using fileRead and fileAppend to manually opening, reading, appending, and closing the files to ensure proper handling, but this didn’t resolve the issue.
Interestingly, when I generate log files using a Python script, my deletion logic works without any problems. This leads me to believe the issue is specifically tied to cflog in Lucee.
Have you encountered this issue before? Is there a reliable way to flush the file I/O buffer or explicitly trigger garbage collection to release the file handles?
As always, I appreciate any help
Thanks in advance!
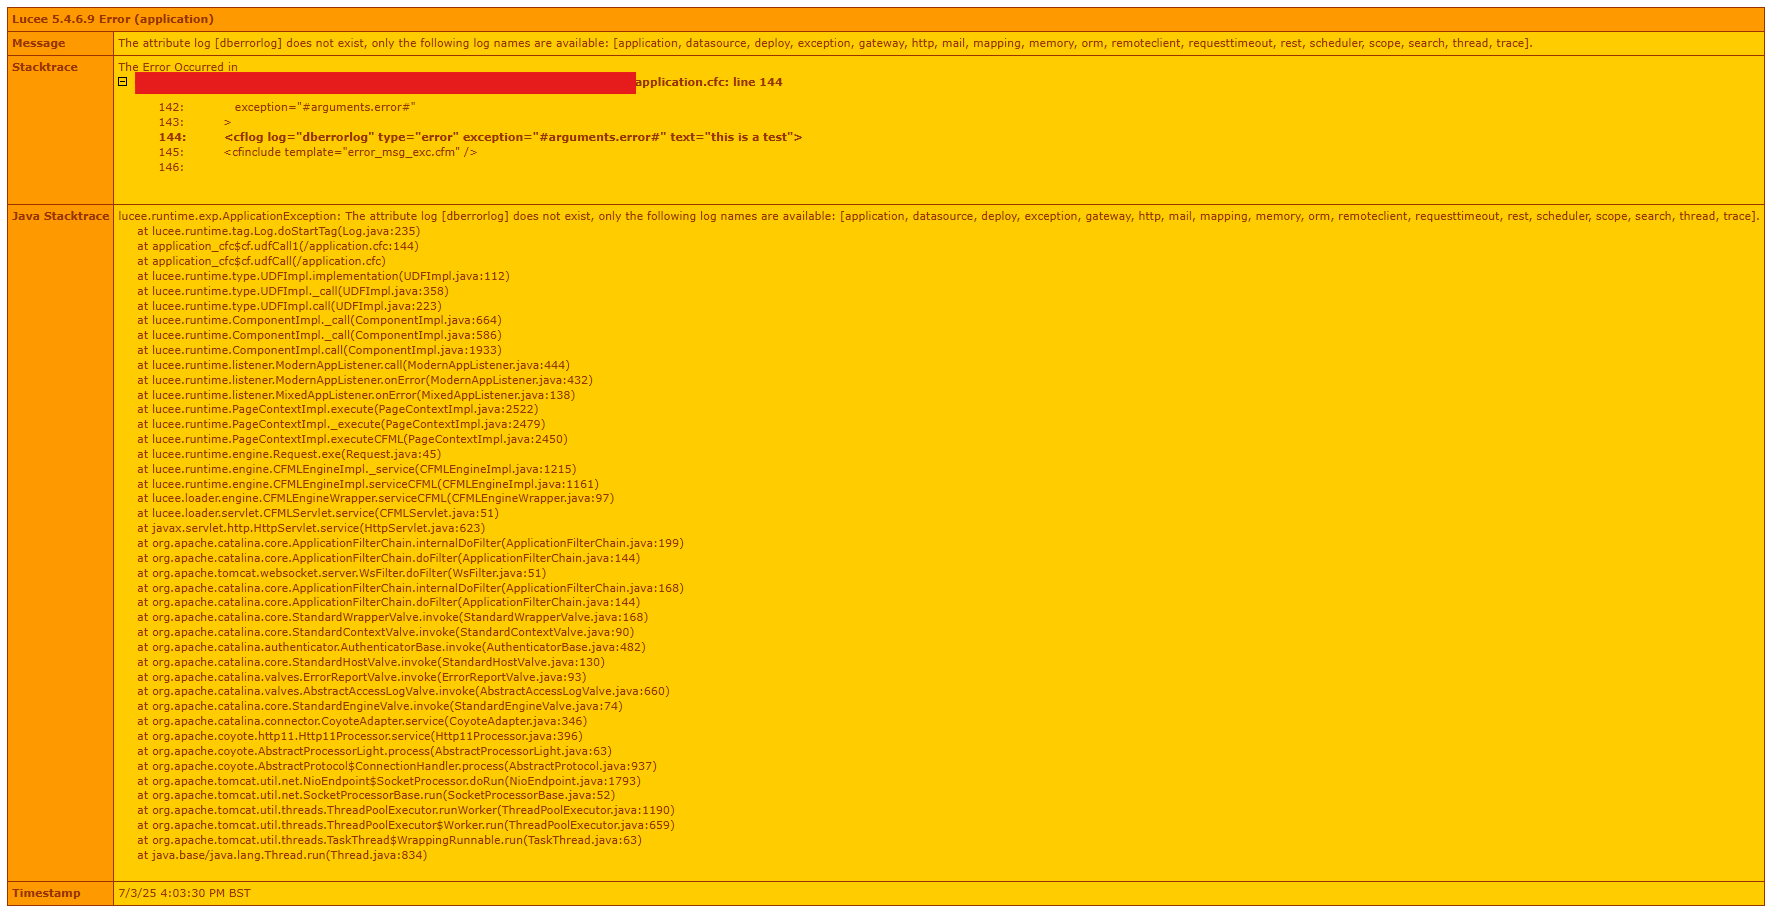
(running Lucee 5.4.6.9)
"Severity","ThreadID","Date","Time","Application","Message"
"ERROR","cfthread-13","07/15/2025","16:42:26","cfthread-13","Can't delete file [WEB-INF\lucee\logs\application.log];lucee.runtime.exp.NativeException: Can't delete file [WEB-INF\lucee\logs\application.log]
	at lucee.commons.io.res.type.file.FileResource.remove(FileResource.java:305)
	at lucee.runtime.functions.file.FileDelete.call(FileDelete.java:37)
	at cfc.com.arup.invest.logutility_cfc$cf.udfCall(/cfc/com/arup/invest/logUtility.cfc:70)
	at lucee.runtime.type.UDFImpl.implementation(UDFImpl.java:112)
	at lucee.runtime.type.UDFImpl._call(UDFImpl.java:358)
	at lucee.runtime.type.UDFImpl.call(UDFImpl.java:223)
	at lucee.runtime.type.scope.UndefinedImpl.call(UndefinedImpl.java:786)
	at lucee.runtime.util.VariableUtilImpl.callFunctionWithoutNamedValues(VariableUtilImpl.java:787)
	at lucee.runtime.PageContextImpl.getFunction(PageContextImpl.java:1776)
	at cfc.com.arup.invest.logutility_cfc$cf.udfCall(/cfc/com/arup/invest/logUtility.cfc:24)
	at lucee.runtime.type.UDFImpl.implementation(UDFImpl.java:112)
	at lucee.runtime.type.UDFImpl._call(UDFImpl.java:358)
	at lucee.runtime.type.UDFImpl.callWithNamedValues(UDFImpl.java:213)
	at lucee.runtime.ComponentImpl._call(ComponentImpl.java:665)
	at lucee.runtime.ComponentImpl._call(ComponentImpl.java:586)
	at lucee.runtime.ComponentImpl.callWithNamedValues(ComponentImpl.java:1947)
	at lucee.runtime.tag.Invoke.doComponent(Invoke.java:209)
	at lucee.runtime.tag.Invoke.doEndTag(Invoke.java:186)
	at cfc.com.arup.invest.thread_cfc$cf.udfCall(/cfc/com/arup/invest/thread.cfc:156)
	at lucee.runtime.type.UDFImpl.implementation(UDFImpl.java:112)
	at lucee.runtime.type.UDFImpl._call(UDFImpl.java:358)
	at lucee.runtime.type.UDFImpl.call(UDFImpl.java:223)
	at lucee.runtime.type.scope.UndefinedImpl.call(UndefinedImpl.java:786)
	at lucee.runtime.util.VariableUtilImpl.callFunctionWithoutNamedValues(VariableUtilImpl.java:787)
	at lucee.runtime.PageContextImpl.getFunction(PageContextImpl.java:1776)
	at cfc.com.arup.invest.thread_cfc$cf.threadCall(/cfc/com/arup/invest/thread.cfc:97)
	at lucee.runtime.thread.ChildThreadImpl.execute(ChildThreadImpl.java:203)
	at lucee.runtime.thread.ChildThreadImpl.run(ChildThreadImpl.java:145)
Caused by: java.io.IOException: Can't delete file [WEB-INF\lucee\logs\application.log]
	... 28 more
"