After updating from version 5.3.2.77 to version 5.3.9.141 we are encountering some issues.
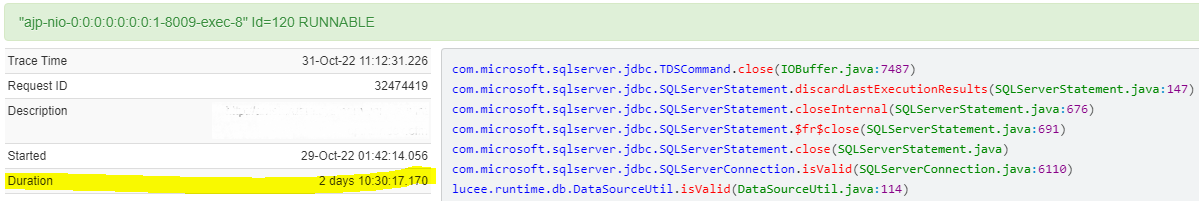
First one is requests getting stuck and using CPU whilst waiting for jdbc.TDSCommand.close. We see nothing on the database that could explain this.
It takes around 5 such requests to max the CPU usage. We can luckily kill them with Fusion Reactor, but it is a daily recurring issue.
Second issue is garbage collection suddenly running more often than normal and maxing the CPU. The only way to fix it is restarting Lucee.
OS : Windows Server 2019 Java Version : 11.0.15+10 Tomcat Version : Apache Tomcat/9.0.62 Lucee Version : 5.3.9.141 Microsoft JDBC Extension Version : 9.4.1
The latest round of pending windows updates is causing performance spikes until installed.
as administrator net stop wuauserv net stop bits net stop cryptsvc ren %systemroot%SoftwareDistributionSoftwareDistribution.sav ren %systemroot%system32catroot2catroot2.sav net start wuauserv net start bits net start cryptsvc
Now update Lucee
Restart your main web service if any
@hpalaz, is your FR the Ultimate edition (or trial)? I ask because it offers a helpful profile feature, and that may help us better understand the problem. As you may know, the stack trace you show is just a point in time, while the profile feature shows processing OVER time. Granted, both are at the level of Java methods, which can seem less useful for some cfml issues, but may BE helpful if in this case it may all be about jdbc-level processing.
And while FR (Ultimate) automatically profiles any request after 3 seconds (and for up to 60 seconds), you can alway click the profile button (among those off the right of your screenshot), to profile the request from that point and for as long as you want. You can then view the profiles taken for that request in its profiles tab, or for all requests under the profile button on the left. If you see neither, you’re not running Ultimate.
Even just a few seconds may help identify the true “hot spot” here. It may be in the MS driver, or the Lucee engine calls to it, or we might even see that somehow it’s your cfml code in an unexpected loop (perhaps caused somehow by your “only” having updated Lucee, yes.)
Maybe someone will solve your problem otherwise, but if not this is a worthwhile effort to attempt. Sadly, it’s hard to share a profile over the web since they often have collapsed segments which if expanded become VERY wide. But I wanted to at least plant this seed.
First, can you look at that fr request (if it’s still running, or next time it does) to see the count of jdbc queries? It’s in the Main tab. I’m just curious if it might show it being in the millions… which would confirm that the cfml is somehow looping, not the driver or the lucee engine. It’s worth confirming, even if you doubt it could be possible.
If that’s not it, then I’ll note that if you’ve not yet run the free trial for FR on this machine, you could get that via their site. It’s just a new license key you’d drop in (you should save off your current one, to put it back in for once the trial is up). No need of a lucee/cd restart.
Finally, if neither pans out, then I’ll bow out for now and leave this to the Lucee giants to sort out by their own debugging prowess.
Can you show the full stack trace? I’m curious what preceeded the JDBC isValid() check. When you upgraded Lucee versions, did you also update to a newer JDBC driver (possibly without realizing it).
I’ve seen some funky stuff with hanging close statements in SQL Server and Azure’s managed DBs with a client once that we traced back to them having like 200 datasources which led to the controller thread doing isValid checks thousands of times a minute. Dunno if it’s related here, but there’s a lot of missing information to be able to piece it together.
The thing is, requests hanging on some sort of DB communication doesn’t usually cause any noticeable amount of CPU usage, so I would question if your CPU overhead is related at all. You also said GC is running more often-- where did you get that information from and what numbers did you observe? What does the used heap sawtooth look like? How big is your heap? Is your server processing the same number of requests? How do you know GC is what’s using the CPU?
And on Charlie’s train of thought, I totally recommend you look into whether those close() threads are actually hung or just in a loop. Often times a thread stuck in a tight loop can appear to be hung if the stack trace always catches the thread at the same point. This is where you REALLY need the FusionReactor Profiler. Or at least, refresh the stack trace for that thread about 50 times in a row (slowly) and see if it changes. You mentioned you’re able to kill these threads which is very interesting since normally a thread stuck on a DB wait can NOT be killed which would support the idea it could be stuck in a loop. Threads stuck in loops can also generate lots of memory usage (which requires GC) and burn CPU.
So, a lot of questions, but the two most important ones in my mind are
what’s the full stack trace so we can see what Lucee is doing there?