Help me understand these "controller took 40105ms to execute successfully" messages

I’m not aware of any issue with this but just wondering what these log entries mean. I have set the Lucee application.log level to “info” to see what things are happening. One log entry that I see repeatedly is:

"INFO","Thread-3","09/28/2023","14:50:02","controller","controller took 40092ms to execute successfully."
"INFO","Thread-3","09/28/2023","15:50:03","controller","controller took 40091ms to execute successfully."
"INFO","Thread-3","09/28/2023","16:50:06","controller","controller took 40088ms to execute successfully."
"INFO","Thread-3","09/28/2023","18:50:08","controller","controller took 40092ms to execute successfully."
"INFO","Thread-3","09/28/2023","19:50:09","controller","controller took 40106ms to execute successfully."
"INFO","Thread-3","09/28/2023","20:50:10","controller","controller took 40090ms to execute successfully."
"INFO","Thread-3","09/28/2023","21:50:12","controller","controller took 40118ms to execute successfully."
"INFO","Thread-3","09/28/2023","22:50:13","controller","controller took 40098ms to execute successfully."
"INFO","Thread-3","09/28/2023","23:50:13","controller","controller took 40111ms to execute successfully."
"INFO","Thread-3","09/29/2023","00:50:14","controller","controller took 40098ms to execute successfully."
"INFO","Thread-3","09/29/2023","01:50:16","controller","controller took 40097ms to execute successfully."
"INFO","Thread-3","09/29/2023","02:50:17","controller","controller took 40094ms to execute successfully."
"INFO","Thread-3","09/29/2023","03:50:18","controller","controller took 40067ms to execute successfully."
"INFO","Thread-3","09/29/2023","04:50:19","controller","controller took 40107ms to execute successfully."
"INFO","Thread-3","09/29/2023","05:50:21","controller","controller took 40092ms to execute successfully."
"INFO","Thread-3","09/29/2023","06:50:22","controller","controller took 40102ms to execute successfully."
"INFO","Thread-3","09/29/2023","07:50:23","controller","controller took 40096ms to execute successfully."
"INFO","Thread-3","09/29/2023","08:50:24","controller","controller took 40096ms to execute successfully."

This is in the application.log under lucee-server context.
Can anyone tell me what these mean?
Why they might be taking so long to execute?
This is currently running on a dev server with little to no traffic at all.

Windows Server 2019
Java 11.0.20
Apache Tomcat/9.0.78
Lucee 5.4.3.11-RC
let me guess, do you have a massive number of files in your temp directory?

the code in question is here

if you are seeing that in dev, you can set the applicaiton.log level to debug to see additional information about what it’s doing in those 40s

Each hour it goes thru and trims down the size of temp directory hourly, it’s not the most efficient implementation see [LDEV-3051] - Lucee

You might want to cleanup temp files after you create them?

2 Likes

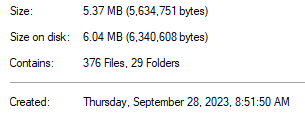
Well you are correct Zac. Looks like the temp folder under the web context has 376 files in there. I didn’t think to look there since this is a basic server without any user traffic. It does have Mura CMS installed. Apparently that has created a bunch of temp files.

that shouldn’t be a problem, I was fearing you had gigs of temp files

Nope, only about 6MB

image

The temp folder under lucee-server context is empty.
The temp folder under tomcat has only 5 files at around 44KB.

Is there some other temp folder?

what’s your jvm memory usage like, it’s also triggers some attempts to free up memory

also as you know when this occuring, you can use my performance analyzer to see what the java threads are doing during that 40s?

2 Likes

This is the additional information that I got in the application.log after setting the level to debug.

"DEBUG","Thread-20075","09/29/2023","10:50:02","lucee.runtime.engine.Controler","Checking size of directory [P:\lucee\web-contexts\site\temp]. Current size [5634751]. Max size [1073741824]."
"DEBUG","Thread-20075","09/29/2023","10:50:02","lucee.runtime.engine.Controler","Checking size of directory [P:\lucee\web-contexts\site\cache]. Current size [0]. Max size [104857600]."

I also see this request timeout in requesttimeout.log

"ERROR","Thread-20259","09/29/2023","10:56:58","controller","stop request (244) because run into a timeout. ATM we have 1 active request(s) and 0 active cfthreads (no path available).;java.lang.Throwable;java.lang.Throwable
	at java.base@11.0.20/java.lang.Object.wait(Native Method)
	at lucee.runtime.tag.Http._doEndTag(Http.java:1117)
	at lucee.runtime.tag.Http.doEndTag(Http.java:696)
	at ext_functions_cfm184$cf.udfCall2(/admin/ext.functions.cfm:523)
	at ext_functions_cfm184$cf.udfCall(/admin/ext.functions.cfm)
	at lucee.runtime.type.UDFImpl.implementation(UDFImpl.java:112)
	at lucee.runtime.type.UDFImpl._call(UDFImpl.java:350)
	at lucee.runtime.type.UDFImpl.call(UDFImpl.java:223)
	at lucee.runtime.type.scope.UndefinedImpl.call(UndefinedImpl.java:786)
	at lucee.runtime.util.VariableUtilImpl.callFunctionWithoutNamedValues(VariableUtilImpl.java:787)
	at lucee.runtime.PageContextImpl.getFunction(PageContextImpl.java:1775)
	at ext_functions_cfm184$cf.udfCall1(/admin/ext.functions.cfm:297)
	at ext_functions_cfm184$cf.udfCall(/admin/ext.functions.cfm)
	at lucee.runtime.type.UDFImpl.implementation(UDFImpl.java:112)
	at lucee.runtime.type.UDFImpl._call(UDFImpl.java:350)
	at lucee.runtime.type.UDFImpl.call(UDFImpl.java:218)
	at lucee.runtime.type.EnvUDF.call(EnvUDF.java:109)
	at lucee.runtime.concurrency.UDFCaller2.call(UDFCaller2.java:84)
	at lucee.runtime.concurrency.UDFCaller2.call(UDFCaller2.java:38)
	at java.base@11.0.20/java.util.concurrent.FutureTask.run(Unknown Source)
	at java.base@11.0.20/java.util.concurrent.ThreadPoolExecutor.runWorker(Unknown Source)
	at java.base@11.0.20/java.util.concurrent.ThreadPoolExecutor$Worker.run(Unknown Source)
	at java.base@11.0.20/java.lang.Thread.run(Unknown Source)
"

I setup tomcat on this server to start the JVM with 1024 of RAM and max at 4096. The server itself has 8GB

@Zac… any chance to pass the request url to the stacktrace? I know its a pure JVM stacktrace, but having the URL that throws the exception would simplify a lot without the need to cross-check further logs