3.0.0.8-SNAPSHOT is out — Lots of variables-panel polish and a couple of fixes that have been annoying me for a while, plus some internal robustness fixes and a lot more more tests.
Component expansion (native mode, 7.1+)
Expanding a CFC in the Variables panel used to be a flat list of every property and method jammed together. Now it splits into:
thisvariablesstaticfunctions(with full function signatures fromgetMetaData())accessors(auto-generated getters/setters derived from property declarations)
Empty groups are omitted. Agent mode still expands flat but with the noisy UDFs filtered out.
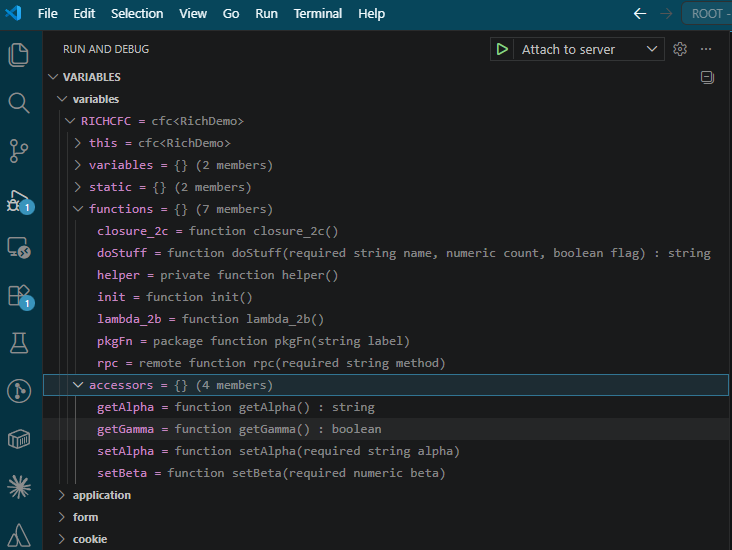
Also fixed: ClassCastException when expanding a Component in native mode — the cast was unconditional but only the agent-mode ComponentImpl has the required mixin, so the native path was throwing. Gated by instanceof now.
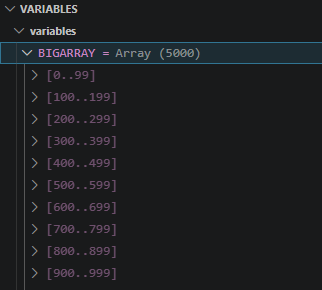
Pagination for large arrays and structs
The Variables panel now honours VSCode’s start / count pagination request and reports indexedVariables / namedVariables. Large arrays and structs chunk into ranges instead of streaming every entry in one shot. Works in both native and agent modes.
More scopes visible
A few new entries in the Variables panel:
cookie
The standard CFML cookie scope, now visible alongside form, url, request, etc.
cfthread
The collection of cfthread-spawned threads in the current request, accessible as cfthread.threadName in CFML. Useful for inspecting state of background or joined threads while suspended in the main thread. Only shown when populated.
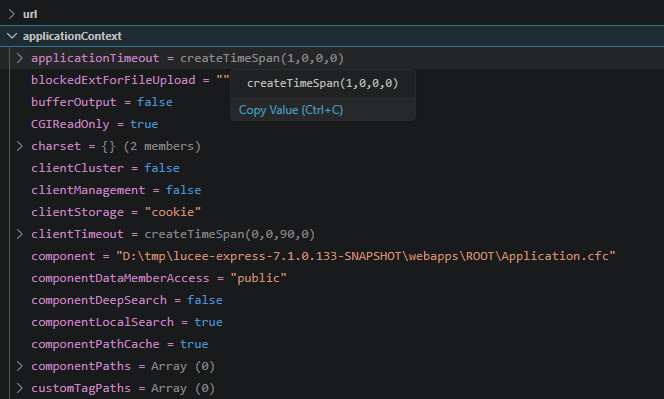
applicationContext
The current application’s settings — mappings, custom tag paths, session config, etc. Lazy-evaluated: the getApplicationSettings() BIF only runs when you expand the scope, not on every stop.
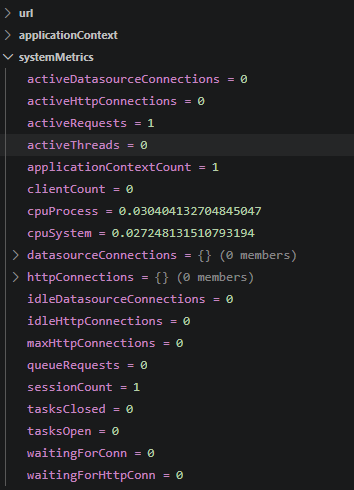
systemMetrics
JVM and OS metrics (memory, CPU, threads, http and jdbc connection pools etc). Same lazy-evaluation pattern, populated by getSystemMetrics() on expand.
Top-level CFM + custom-tag variables scope fix (LDEV-6337, native + core fix)
Two related fixes:
- Breakpoints at the top level of a
.cfmtemplate had novariablesscope visible at all - Breakpoints inside a
cfmodule/ custom-tag body were leaking the caller’svariablesscope instead of the tag’s own
Both are fixed via the INCLUDE debugger frame using the live variablesScope() rather than inheriting from the enclosing frame. Native-only — agent mode wasn’t affected.
Debug console eval without a selected frame
If no frame was selected in the call stack panel, the debug console would refuse to evaluate with “missing frameID”. Now it evaluates against any suspended PageContext, so you can ad-hoc-inspect state without clicking into a specific frame first. Native only.
API version handshake (LDEV-6344)
Behind-the-scenes plumbing: extension and core now negotiate an API version on registration. If the extension is too old for the running core (or vice versa), the IDE gets the actual reason in the attach error dialog rather than a generic “Invalid or missing secret”.
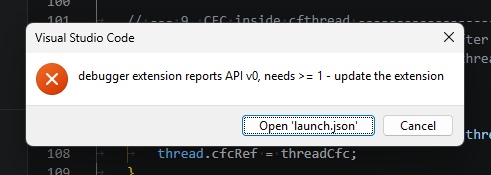
This is the groundwork for letting Lucee evolve the debugger contract without silently breaking shipped extensions — old extensions will get a clear “update the extension” message in VSCode rather than mystery breakage mid-session.
Install
Full setup instructions in the README.
Extension (Lucee 7.1.0.137-SNAPSHOT+)
LUCEE_EXTENSIONS=org.lucee:debugger-extension:3.0.0.8-SNAPSHOT
Remember to set LUCEE_DAP_SECRET and LUCEE_DAP_PORT and restart.
Java Agent (Lucee 6.x / 7.0)
See JAVA_AGENT.md for JVM startup configuration.
Docs
cfdump, cfabort? nah, try ‘breakpoint()’ !
Changelog
Feedback welcome.