I’m seeing what appear to be class loader issues under load.
When running a stress test on our application, I’m seeing our unit tests suite (which is not part of the stress test) throwing tons of random errors like the following:
"ERROR","http-nio-8080-exec-24","02/06/2026","22:08:54","http://unittests.localhost:80","compile","shared.services.notification.message.changemessage_cfc$cf$4xsjava.lang.ClassNotFoundException: shared.services.notification.message.changemessage_cfc$cf$4xs
        at lucee.commons.lang.PhysicalClassLoader.loadClass(PhysicalClassLoader.java:324)
        at lucee.commons.lang.PhysicalClassLoader.loadClass(PhysicalClassLoader.java:195)
        at lucee.runtime.MappingImpl.loadClass(MappingImpl.java:281)
        at lucee.runtime.MappingImpl.getPhysicalClass(MappingImpl.java:294)
        at lucee.runtime.PageSourceImpl.loadPhysical(PageSourceImpl.java:338)
        at lucee.runtime.PageSourceImpl.loadPageThrowTemplateException(PageSourceImpl.java:176)
        at lucee.runtime.PageSourceImpl.loadPage(PageSourceImpl.java:1099)
        at lucee.runtime.component.ComponentLoader._search(ComponentLoader.java:394)
        at lucee.runtime.component.ComponentLoader._search(ComponentLoader.java:200)
        at lucee.runtime.component.ComponentLoader.searchComponent(ComponentLoader.java:95)
        at lucee.runtime.functions.other.GetComponentMetaData.call(GetComponentMetaData.java:51)
        at com.thirdparty.frameworks.fw1.ioc_cfc$cf.udfCall2(/givaroot/com/thirdparty/frameworks/fw1/ioc.cfc:331)
        at com.thirdparty.frameworks.fw1.ioc_cfc$cf.udfCall(/givaroot/com/thirdparty/frameworks/fw1/ioc.cfc)
While the load generated by the stress tests may not be the root cause, I’ve only noticed the problem when the stress tests are running.
I’m wondering if maybe this is due to the recent fixes to try and fix the class loader memory leaking issues. I believe I read @micstriit recently made some changes that end up with new class loaders sometimes when trying to manage the memory leaks. I’m wondering if these exceptions are a result of Lucee being in the process of changing the class loader to use under load, but that’s just a guess on my part.
I will say when these errors end up filling up my application.log log files, but I’m not seeing signs of exceptions triggered in the code that’s running. When these java.lang.ClassNotFoundException exceptions get thrown they do not appear to be boiling up to the running code. It seems like Lucee is re-trying the operation but logging the exception anyway.
OS: Oracle Linux 9.7
Java Version: OpenJDK 25
Tomcat Version: 11.0.18
Lucee Version: 7.0.2.83-RC
Any thoughts on why this might be happening?
I’ve been running a continual stress test on our QA servers for the last 15+ hours. This is the only thing happening on the box right now. I’m still seeing exceptions like this getting logged in our application.log file:
"ERROR","http-nio-8080-exec-5","02/07/2026","11:09:38","http://localhost:80","compile","admin.administration_cfm$cf$di7java.lang.ClassNotFoundException: admin.administration_cfm$cf$di7
        at lucee.commons.lang.PhysicalClassLoader.loadClass(PhysicalClassLoader.java:324)
        at lucee.commons.lang.PhysicalClassLoader.loadClass(PhysicalClassLoader.java:195)
        at lucee.runtime.MappingImpl.loadClass(MappingImpl.java:281)
        at lucee.runtime.MappingImpl.getPhysicalClass(MappingImpl.java:294)
        at lucee.runtime.PageSourceImpl.loadPhysical(PageSourceImpl.java:338)
        at lucee.runtime.PageSourceImpl.loadPageThrowTemplateException(PageSourceImpl.java:176)
        at lucee.runtime.PageSourceImpl.loadPage(PageSourceImpl.java:1110)
        at lucee.runtime.PageContextImpl._doInclude(PageContextImpl.java:1110)
        at lucee.runtime.PageContextImpl._doInclude(PageContextImpl.java:1008)
        at lucee.runtime.PageContextImpl.doInclude(PageContextImpl.java:989)
        at admin.index_cfm$cf.call(/admin/index.cfm:1)
        at lucee.runtime.PageContextImpl._doInclude(PageContextImpl.java:1114)
        at lucee.runtime.PageContextImpl._doInclude(PageContextImpl.java:1008)
        at lucee.runtime.listener.ModernAppListener._onRequest(ModernAppListener.java:239)
        at lucee.runtime.listener.MixedAppListener.onRequest(MixedAppListener.java:43)
        at lucee.runtime.PageContextImpl.execute(PageContextImpl.java:2806)
        at lucee.runtime.PageContextImpl._execute(PageContextImpl.java:2793)
        at lucee.runtime.PageContextImpl.executeCFML(PageContextImpl.java:2764)
        at lucee.runtime.engine.Request.exe(Request.java:45)
        at lucee.runtime.engine.CFMLEngineImpl._service(CFMLEngineImpl.java:1213)
        at lucee.runtime.engine.CFMLEngineImpl.serviceCFML(CFMLEngineImpl.java:1170)
        at lucee.loader.engine.CFMLEngineWrapper.serviceCFML(CFMLEngineWrapper.java:99)
        at lucee.loader.servlet.jakarta.CFMLServlet.service(CFMLServlet.java:41)
        at jakarta.servlet.http.HttpServlet.service(HttpServlet.java:710)
        at org.apache.catalina.core.ApplicationFilterChain.doFilter(ApplicationFilterChain.java:128)
        at org.apache.tomcat.websocket.server.WsFilter.doFilter(WsFilter.java:53)
        at org.apache.catalina.core.ApplicationFilterChain.doFilter(ApplicationFilterChain.java:107)
        at com.givainc.tomcat.jakarta.filters.PathInfoParserFilter.doFilter(PathInfoParserFilter.java:61)
        at org.apache.catalina.core.ApplicationFilterChain.doFilter(ApplicationFilterChain.java:107)
        at java.base/jdk.internal.reflect.DirectMethodHandleAccessor.invoke(DirectMethodHandleAccessor.java:104)
        at java.base/java.lang.reflect.Method.invoke(Method.java:565)
        at com.intergral.fusionreactor.j2ee.jakarta.filterchain.WrappedFilterChain.doFilter(WrappedFilterChain.java:132)
        at com.intergral.fusionreactor.j2ee.jakarta.filter.FusionReactorRequestHandler.doNext(FusionReactorRequestHandler.java:705)
        at com.intergral.fusionreactor.j2ee.jakarta.filter.FusionReactorRequestHandler.doHttpServletRequest(FusionReactorRequestHandler.java:263)
        at com.intergral.fusionreactor.j2ee.jakarta.filter.FusionReactorRequestHandler.doFusionRequest(FusionReactorRequestHandler.java:126)
        at com.intergral.fusionreactor.j2ee.jakarta.filter.FusionReactorRequestHandler.handle(FusionReactorRequestHandler.java:743)
        at com.intergral.fusionreactor.j2ee.jakarta.filter.FusionReactorCoreFilter.doFilter(FusionReactorCoreFilter.java:35)
        at java.base/jdk.internal.reflect.DirectMethodHandleAccessor.invoke(DirectMethodHandleAccessor.java:104)
        at java.base/java.lang.reflect.Method.invoke(Method.java:565)
        at com.intergral.fusionreactor.j2ee.jakarta.filterchain.WrappedFilterChain.doFilter(WrappedFilterChain.java:69)
        at java.base/jdk.internal.reflect.DirectMethodHandleAccessor.invoke(DirectMethodHandleAccessor.java:104)
        at java.base/java.lang.reflect.Method.invoke(Method.java:565)
        at com.intergral.fusionreactor.agent.filter.FusionReactorStaticFilter.doFilterJakarta(FusionReactorStaticFilter.java:282)
        at com.intergral.fusionreactor.agent.pointcuts.jakarta.JakartaNewFilterChainPointCut$1.invoke(JakartaNewFilterChainPointCut.java:48)
        at org.apache.catalina.core.ApplicationFilterChain.doFilter(ApplicationFilterChain.java)
        at org.apache.catalina.core.StandardWrapperValve.invoke(StandardWrapperValve.java:165)
        at org.apache.catalina.core.StandardContextValve.invoke(StandardContextValve.java:77)
        at org.apache.catalina.authenticator.AuthenticatorBase.invoke(AuthenticatorBase.java:492)
        at org.apache.catalina.core.StandardHostValve.invoke(StandardHostValve.java:113)
        at org.apache.catalina.valves.ErrorReportValve.invoke(ErrorReportValve.java:83)
        at org.apache.catalina.core.StandardEngineValve.invoke(StandardEngineValve.java:72)
        at org.apache.catalina.valves.RemoteIpValve.invoke(RemoteIpValve.java:685)
        at org.apache.catalina.connector.CoyoteAdapter.service(CoyoteAdapter.java:341)
        at org.apache.coyote.http11.Http11Processor.service(Http11Processor.java:397)
        at org.apache.coyote.AbstractProcessorLight.process(AbstractProcessorLight.java:63)
        at org.apache.coyote.AbstractProtocol$ConnectionHandler.process(AbstractProtocol.java:903)
        at org.apache.tomcat.util.net.NioEndpoint$SocketProcessor.doRun(NioEndpoint.java:1779)
        at org.apache.tomcat.util.net.SocketProcessorBase.run(SocketProcessorBase.java:52)
        at org.apache.tomcat.util.threads.ThreadPoolExecutor.runWorker(ThreadPoolExecutor.java:946)
        at org.apache.tomcat.util.threads.ThreadPoolExecutor$Worker.run(ThreadPoolExecutor.java:480)
        at org.apache.tomcat.util.threads.TaskThread$WrappingRunnable.run(TaskThread.java:57)
        at java.base/java.lang.Thread.run(Thread.java:1474)
According to our stress test, the /admin/ endpoint has never encountered an exception (which goes against the exception stacktrace above):
So while I definitely could be wrong, it definitely seems like this might have something to do w/the recent class loader fixes and how (from my understanding) it sometimes warms up a new main class loader and then destroys the old one.
And to to clarify, my 15 hour stress test has produce like a 100+ MBs of these exceptions. It’s not just a few. They seem to come in batches. It generate a few dozen at a time and then it won’t happen again for a while. The cycle keeps repeating itself.
However, if I run my unit test suite during the stress test, it will trigger quite frequently.
What I suspect is happening is during the stress test, we simulate 20 concurrent users accessing a bunch of predefined pages. The page order is randomized and the “entity” being viewed is randomized, but it’s the same core pages being viewed over and over. This means the code path is relatively the same, so there’s not going to be a ton of deviation in the components and Java objects being invoked (although the randomness of the entities being viewed does ensure some deviation).
However, when I run the unit test suite while the stress test is happening, Lucee being forced to generate a lot more classes. Our unit test suite has over 23K+ tests. This is when I see a flood of these java.lang.ClassNotFoundException exception. I think this might be because Lucee is trying to free up memory and it abandons the class loader that was being used and creates a new one to free up memory.
Anyway, just a thought.
@micstriit/@Zackster,
Is there anything I can provide you which would help to understand what’s happening?
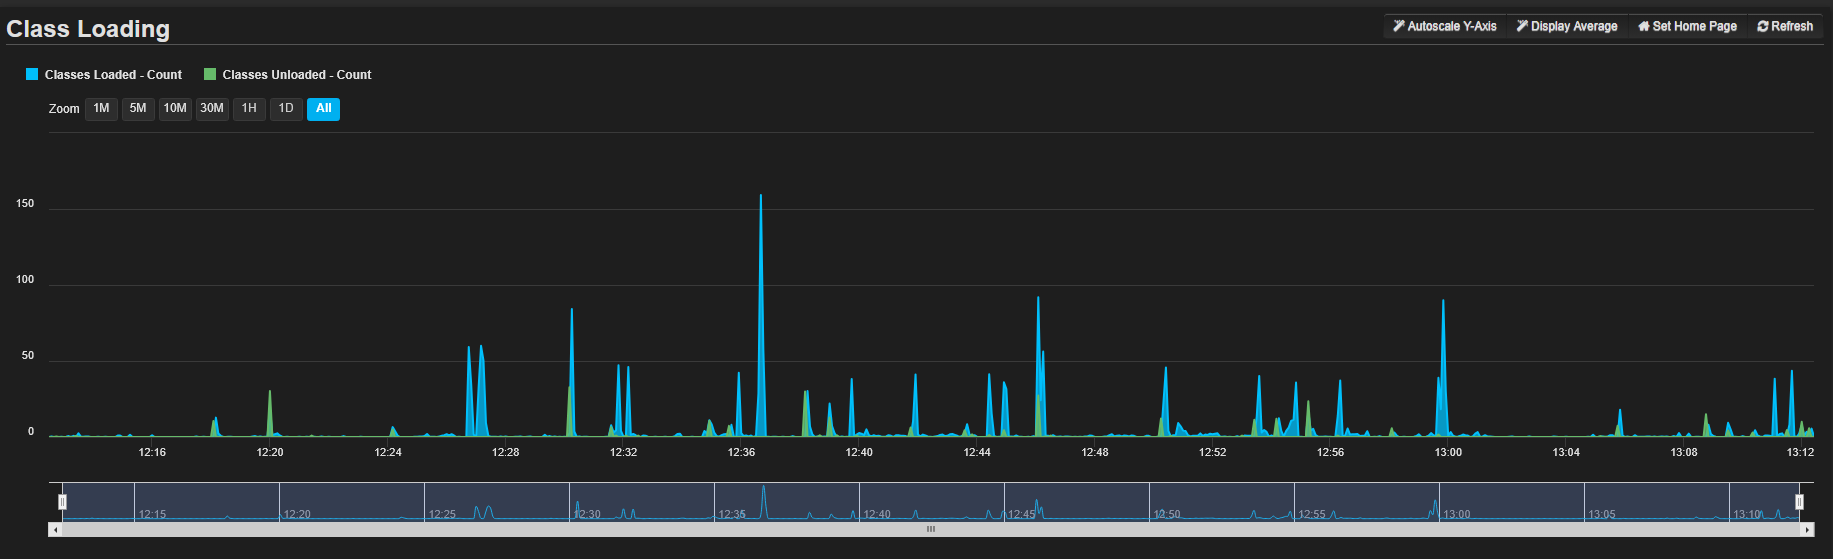
In doing some more testing this morning, whenever the “Classes loaded” count gets around the 50 peak lines, I end up getting a flood of exceptions in my logs:
Once again, these exceptions do not lead to errors in the code running, just exceptions being logged (and lots of them!!!).
Some more details. I’m also seeing some exceptions like this:
"ERROR","http-nio-8080-exec-5","02/07/2026","13:35:25","http://unittests.localhost:80","dynamic","class com.google.re2j.Matcher cannot be cast to class java.util.regex.MatchResult (com.google.re2j.Matcher is in unnamed module of loader lucee.commons.lang.PhysicalClassLoader @1bbd5009; java.util.regex.MatchResult is in module java.base of loader 'bootstrap')java.lang.ClassCastException: class com.google.re2j.Matcher cannot be cast to class java.util.regex.MatchResult (com.google.re2j.Matcher is in unnamed module of loader lucee.commons.lang.PhysicalClassLoader @1bbd5009; java.util.regex.MatchResult is in module java.base of loader 'bootstrap')
In the above situation, I have a an instance of com.google.re2j.Pattern created via createObject("java", "com.google.re2j.Pattern", variables.jarLibs) which then caches the results of the Pattern.compile(). I think this is a similar issue in that that main class loader gets replaced and so then it can no longer pull from the RE2 JAR file.
I’m also seeing a flood of ERRORs that end up not including the stacktrace, just the error line:
"ERROR","http-nio-8080-exec-5","02/07/2026","13:35:29","http://unittests.localhost:80","dynamic","java.lang.ClassCastExceptionjava.lang.ClassCastException
"
"ERROR","http-nio-8080-exec-5","02/07/2026","13:35:29","http://unittests.localhost:80","dynamic","java.lang.ClassCastExceptionjava.lang.ClassCastException
"
"ERROR","http-nio-8080-exec-5","02/07/2026","13:35:29","http://unittests.localhost:80","dynamic","java.lang.ClassCastExceptionjava.lang.ClassCastException
"
I’ve attached a log file with a full snippet of such an event (see application.log (1.1 MB))
Dan, great recon so far there.
While you await a better reply, I’ve noticed that your initial stack trace indicates you have FR implemented. Since it can have even a slight connection to the issue, have you confirmed that the exact same pattern of errors occurs even if it’s removed?
If somehow it went away, there could even be some feature of FR at play here (whether enabled by you or by default, such as the event snapshot feature). You could then try disabling that (under the debug>settings button).
I’d recommend you try things in that order, though, as obviously if removing FR entirely doesn’t help then it’s not at all to blame.
And if it needs be said for some readers, I do love FR and it never SHOULD cause any negative impact. (And if it DID, the Intergral team would rectify it.) It’s just that there may be impacts of recent Lucee changes which might not yet have been stress-tested with some specific combinations of other things, which time could of course reveal.
Finally, though Dan surely knows it, I’ll clarify that “removing FR” does NOT mean uninstalling it, not removing it via FRAM (if used). You can simply remove the two javaagent and agentpath elements pointing FR in the jvm args used to start up Lucee (or CF or BoxLang)z then restart it.
Sorry if this proves to be a red herring.
@carehart
Good point! I have thought about that and will try that Monday and see what the results are.
Side note — I will say our FR instance has exception tracing disabled (e.g. -Dfr.jvmti.enable.exceptions=false) as my testing show it decreased performance by 60%, which I believe prevents the “event snapshot” feature from doing anything.
I don’t want to restart Tomcat right now to test this theory, because I’m trying to run these load tests over several days to try and confirm for @micstriit that the memory leak issue with the class loaders has been resolved.
Fortunately, it’s seems pretty easy to recreate the logs. I just need to run my unit test suite under very heavy application load.
I’ve sort of alluded to, I’m not sure there’s really a problem with the application workflow, other than the excessive log generation. It seems like Lucee is technically working as excepted (outside of the RAM drive issue I also reported), but at bare minimum it certainly should not be writing these exceptions as ERROR level logging. If this is “by design”, it should probably logging these as DEBUG or TRACE log entries, so it doesn’t show up by default and only renders in the logs when you need more thorough logging.
Something else worth noting, these exceptions do not show up in the exception.log, only the application.log.
Understood, on all points. 
Bug filed, i think it’s an easy fix, see what @micstriit says, and as @carehart says, excellent bug reporting, you get a gold star and an ice cream!
https://luceeserver.atlassian.net/browse/LDEV-6107
that said, I’d say the using a ram drive for images is a bit of a myth (i remember it), the latest v3 image extension is way more efficient at resizing with memory GCs and much faster! LDEV-3967.
Modern filesystems cache files to memory anyway and SSDs are much faster than spinning disks from when this idea dates back too.
The most important thing to remember about working with images is to read them into memory once and then do all the operations on that image obj, otherwise, working directly on a file (using a path) really hammers the memory each time as the compressed image is decompressed over and over per image operation!
As for the ram drive disappearing, I’ll have a look into that as well
https://luceeserver.atlassian.net/browse/LDEV-1109
Greetings from my parents place in Melbourne!
Thanks for getting this take care of. Still waiting on my ice cream though.