Lucee makes use of JFreeChart (see JFreeChart) for cfchart. Lucee knows Java and JFreeChart can directly be invoked with CFML. Because I’m still in the process of learning JAVA and how to integrate it into Lucees CFML, I’ve tried playing around a little with JFreeChart. I’ve found some references over the internet with integrating it into CFML, but I had to dig and experiment around with the documentation and code…
I’ve found JFreeChart very powerfull. In my opinion cfchart does everything you really need, and my personal oponion I like it with the margins better than without (just like Lucees cfchart does it). But that may be personal preference. If you need more control of creating charts, than you’ll need to use JFreeChart directly.
I’m sharing here all my code for everyone who is willing to experiment. I’ve adapted it to what you need to do.That will add some content to this forum and might help someone else digging around this topic.
<cfscript>
// create all objects
ObjChartFactory = CreateObject("java", "org.jfree.chart.ChartFactory");
ObjChartOrient = CreateObject("java", "org.jfree.chart.plot.PlotOrientation");
ObjChartUtil = CreateObject("java", "org.jfree.chart.ChartUtilities");
ObjXYLineAndShapeRenderer = CreateObject("java", "org.jfree.chart.renderer.xy.XYLineAndShapeRenderer");
ObjBasicStroke = CreateObject("java", "java.awt.BasicStroke");
ObjChartColor = CreateObject("java", " org.jfree.chart.ChartColor");
ObjRectangleInsets = CreateObject("java", "org.jfree.ui.RectangleInsets");
ObjShapeUtilities = CreateObject("java", "org.jfree.util.ShapeUtilities");
ObjXYSeriesCollection = CreateObject("java", "org.jfree.data.xy.XYSeriesCollection");
ObjXYDataset= CreateObject("java", "org.jfree.data.xy.XYDataset");
ObjXYSeries= CreateObject("java", "org.jfree.data.xy.XYSeries");
ObjNumberAxis= CreateObject("java", "org.jfree.chart.axis.NumberAxis");
ObjNumberTickUnit= CreateObject("java", "org.jfree.chart.axis.NumberTickUnit");
ObjStandardXYItemLabelGenerator = CreateObject("java", "org.jfree.chart.labels.StandardXYItemLabelGenerator ");
ObjXYItemLabelGenerator = CreateObject("java", "org.jfree.chart.labels.XYItemLabelGenerator");
ObjNumberFormat= CreateObject("java", "java.text.NumberFormat");
ObjFont=CreateObject("java", "java.awt.Font");
// Initialize Series
XYSeries=ObjXYSeries.init("series1");
// add data to series
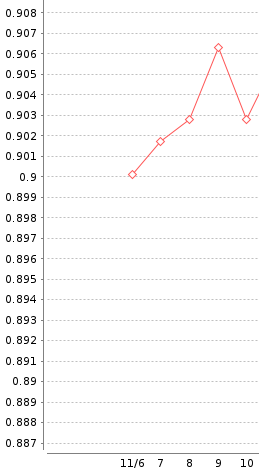
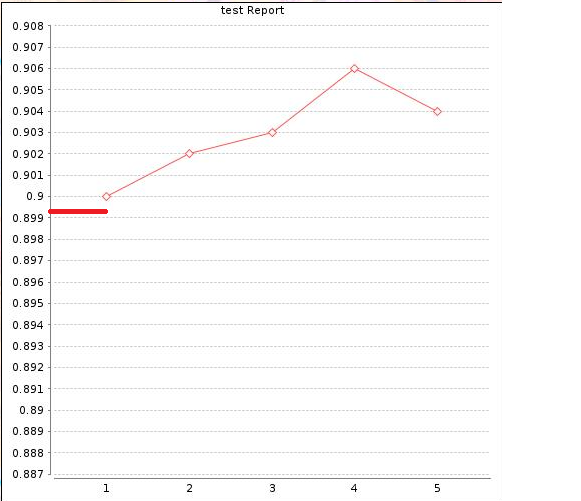
XYSeries.add(1,0.9);
XYSeries.add(2,0.902);
XYSeries.add(3,0.903);
XYSeries.add(4,0.906);
XYSeries.add(5,0.904);
// Initialize second series
XYSeries2=ObjXYSeries.init("series2");
// add data to series
XYSeries2.add(1,0.906);
XYSeries2.add(2,0.904);
XYSeries2.add(3,0.900);
XYSeries2.add(4,0.901);
XYSeries2.add(5,0.904);
// initialize XYSeriesCollection
XYDataset=ObjXYSeriesCollection.init();
//add both series to collection
XYDataset.addSeries(XYSeries);
XYDataset.addSeries(XYSeries2);
// Set Chart as createXYLineChart
Chart = ObjChartFactory.createXYLineChart ("This is some Title", "Name 1", "Name 2", XYDataset, ObjChartOrient.VERTICAL, true, true, true);
// Set Range of Range Axis (y)
Chart.getPlot().getRangeAxis().setRange(0.887, 0.908);
// Set Range of Domain Axis (x)
Chart.getPlot().getDomainAxis().setRange(1, 5);
// Force Domain Axis to show values as Integer
Chart.getPlot().getDomainAxis().setStandardTickUnits(ObjNumberAxis.createIntegerTickUnits());
// Define Steps of Values of Domain Axis (x)
Chart.getPlot().getDomainAxis().setTickUnit(ObjNumberTickUnit.init(0.5));
// Define Steps of Values of Range Axis (y)
Chart.getPlot().getRangeAxis().setTickUnit(ObjNumberTickUnit.init(0.005));
// Remove Legend
Chart.removeLegend();
// Init
barrenderer = ObjXYLineAndShapeRenderer.init();
//define Color for each serie
barrenderer.setSeriesPaint(0,ObjChartColor.RED);
barrenderer.setSeriesPaint(1,ObjChartColor.LIGHT_GREEN);
//define Stroke for each serie
barbasicstroke = ObjBasicStroke.init(4);
barrenderer.setSeriesStroke(0,barbasicstroke);
barrenderer.setSeriesStroke(1,barbasicstroke);
//define Type of Markers for each serie
triangle = ObjShapeUtilities.createDownTriangle(5);
diamond = ObjShapeUtilities.createDiamond(8);
barrenderer.setSeriesShape(0, triangle);
barrenderer.setSeriesShape(1, diamond);
barrenderer.setShapesFilled(true);
barrenderer.setShapesVisible(true);
// Set color of LabelValues
barrenderer.setBaseItemLabelPaint(ObjChartColor.WHITE);
// Set format for LabelValues and limit showing digits for use in Label-Genertator
format = ObjNumberFormat.getNumberInstance();
format.setMaximumFractionDigits(2);
// initialize XYItemLabelGenerator: it sets the content and the format of the shown data. ("Some text {datasetIndex}",format)
tmpgenerator=ObjStandardXYItemLabelGenerator.init("Y={2}/X={1}", format, format);
// initialize font with ObjFont.init( FontFamily, Style( bitwise: 0=normal, 1=bold, 2=italic, 3=bold|italic), size )
font=ObjFont.init("Verdana",1,12);
//Set font for ItemLables
barrenderer.setBaseItemLabelFont(font);
//Generate ItemLables
barrenderer.setBaseItemLabelGenerator(tmpgenerator);
barrenderer.setBaseItemLabelsVisible(true);
Chart.getPlot().setRenderer(barrenderer);
// Set Margins (top, left, bottom, right)
newrectangle=ObjRectangleInsets.init(20,0,0,50);
Chart.getPlot().setAxisOffset(newrectangle);
// Change Background Color
Chart.getPlot().setBackgroundPaint( ObjChartColor.BLUE );
// Change GridlineColors for Domain Axis (x)
Chart.getPlot().setDomainGridlinePaint(ObjChartColor.WHITE);
// Change GridlineColors for Range Axis (y)
Chart.getPlot().setRangeGridlinePaint(ObjChartColor.LIGHT_GREEN);
// Prepare for Output
ChartImage = Chart.createBufferedImage(500, 500);
ImageFormat = createObject("java", "org.jfree.chart.encoders.ImageFormat");
EncoderUtil = createObject("java", "org.jfree.chart.encoders.EncoderUtil");
ChartImgInBytes = EncoderUtil.encode( ChartImage, ImageFormat.PNG);
</cfscript>
<!--- display in browser --->
<cfoutput>
<img src="data:image/*;base64,#toBase64( ChartImgInBytes )#" />
</cfoutput>
.