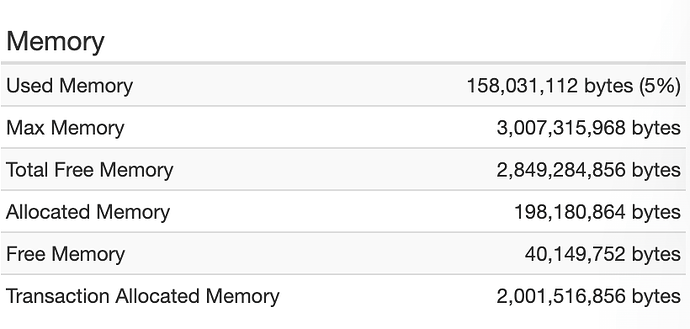
Matt, this is a very frequent cause of concern/confusion. The way I explain it is that the tracking is of all memory (heap) allocation during THE LIFE of the request (meaning WITHIN that request, not related to any others to be clear).
Elaboration follows, so this is a classically longer reply from me. Some may get value out of just the first paragraph alone. For others interested to know more, read on. I don’t like the way numbering creates indentation, so I have separated groups of thoughts with a “…” indication.
…
We all tend to think this “transaction allocated memory” is showing some sort of “peak”…as in the “most memory used” at one time in the request.
But that then doesn’t make sense of it reports gigs of memory (or event 10s of gigs) more than the xmx/heap max for our instance (whether Lucee or CF or any other Java app that fr is monitoring).
Indeed, that “really high amount” shows us that the jvm is doing Gc’s (as it should, during the request) and so it is recovering objects when they’re no longer in use. But the feature is tracking ALL those allocations in that request, without regard to their later cleanup by the Gc’s.
So, that’s the big picture. There’s of course still the question of “what the hell is allocating so much memory??”
…
And that “allocation of memory during the life of the request” would basically be down to whatever the request is doing: perhaps returning a lot of data from a query, or from an api call, or the like. Or perhaps it’s looping over such data or some other large set of data, perhaps.
Or maybe your code runs some cfml feature that does a lot of work in the background (not based on a large amount of your cfml, per se) , like spreadsheet or pdf processing, or the like.
These are just SOME ideas. It could really be anything.
…
Sadly, FR does not break down the memory use (or allocations) at the request level beyond what you see there (let alone cfml level).
There IS the fr memory profiling (heap snapshot) feature, but that’s across the entire heap and ALL requests running (or that have run, creating objects in heap), so that won’t likely help here.
If somehow you could run that request and NO OTHER, between a couple of Gc’s, then the feature to compare two such heap snapshots might be helpful for you, at least to see what KIND of objects were created. It does track both differences in the SIZE of objects and their COUNT. But the effort often leaves people wanting, as it’s low-level Java object types, which one might struggle to relate to cfml-generated objects.
…
And knowing now what I’ve said, even without the heap profile, you may look at what your request is doing and perhaps you’ll see something differently. You’re a smart guy, so I’ll keep hope alive for you on both the last two points. 
Finally, it should be clear now that the issue has nothing directly to do with the size of what’s RETURNED to the user (you could return some file that did not need to be loaded into memory). But of course if you do produce a LOT of content as the response, you might find there’s something about that process which could be driving up heap allocations.
…
Again, though, since the Gc’s are keeping up (lucee is not going down on you), the allocations alone are not necessarily where you need to look to understand whatever is the original reason you looked into this indication on the request details page, or some may notice the related “requests by memory” page.
And perhaps that heap profile feature MAY help you there. I’ve also done some videos/presentations on solving memory problems with fr (done before the heap profile feature was made available).
…
Or of course I help people directly with such problems. Sometimes I help connect dots far more readily than some might on their own. It’s their call. As always, I don’t charge for time that’s found not to be valuable.
Sadly, I can’t cover/refund the cost for the time it takes to read my long replies like this.  I just never know who will read it, what they do know, what they want or don’t want to know, etc.
