I’ve not tried any of the suggestions yet in regard to java arguments. We’ve been using CF10 for years and decided to move all of our production work to Lucee. I’ve been doing the move in batches. The first batch was 10 high-traffic sites. I’ve had no issues. With that server being stable, I decided to move around 120 low-traffic sites to another server. That server has 15 GB of ram. I set the initial memory pool and max to 6 GB. Garbage collection was working with no issue, however, the non-heap memory grew until the server crashed. Tomcat logs indicated that the server was out of memory. My first thought was JVM tuning, the reason for the thread.
Later I found out that the server itself was running out of memory. When I moved the sites over, they were created in their own IIS app pool. That was creating about 6 GB of allocation for IIS in ram. I then moved all those sites into one app pool. Doing so released about 4 GB of ram.
So far the server has only crashed once in two weeks due to “There is insufficient memory for the Java Runtime Environment to continue” according to the logs, which seems to me is non-heap increasing until the server crashes. Similar to this issue - [LDEV-2904] - Lucee
As of right now, the server IMO is stable. I can live with an occasional reboot, been dealing that that anyway with CF10 since day one
OK on all that, and it sounds like you are almost feeling like it’s "problem solved’.
But about the occasional crashes, when you say that non-heap “seems” to be increasing, are you viewing that info specifically in the Lucee Admin (or in FR, or in any Java monitoring tool), or just going on a general assertion based on your understanding of things?
Just keep in mind again that the “insufficient memory” problem (which is about the box not having enough memory when the JVM/Lucee/Tomcat asked for it) could have as much to do with other things on the machine using memory (like the IIS workers as before), or about the lucee/jvm heap being set to a larger number than would be allowed (under such conditions), or perhaps finally (nut not necessarily) about “non-heap” jvm memory configuration (which covers a variety of jvm memory spaces).
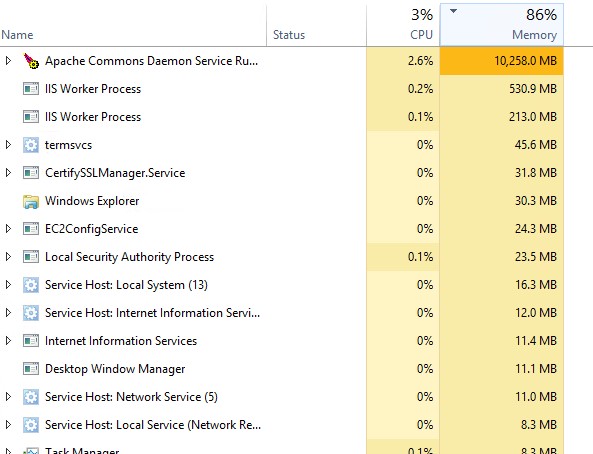
I’ve tried to use FR but I don’t fully understand what it is I’m looking for in regards to memory issues. I’m going by the fact and as of right now, that server has 15 GB of ram installed, is running at 98% fully utilized with Lucee/Tomcat allocating 12 GB of ram, even though I’ve set the Maximum pool to 6 GB. So I would have to assume that that is a Lucee issue? If I set Initial and Max to 6 GB why is the service using 12 GB currently?
I addressed that latter point in my first reply to you. Please reconsider it, and then ask clarifying questions. (Until you resolve that issue, FR is not really what you need for now.)
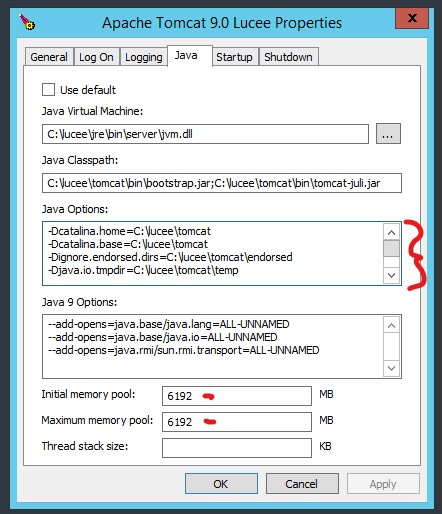
The ‘java options’ section was where I was entering the options. Doing so would keep the service from starting. The initial memory and max memory is where the 6 gb allocation is being set.
When you say, “the ‘java options’ section was where I was entering the options. Doing so would keep the service from starting”, I had said originally, "To be clear, those args need to each be on their own line (in that “java options” tab, as opposed to about anywhere else)."
Are you confirming you had done those on separate lines? That’s so easy to miss.
And what args did you use? The first post where you mentioned doing this had the xns and xmx, which again should NOT be there but in the ui’s fields for it.
Second, you had said your non-heap was rising. I’d asked if and how you’re monitoring that. If it really IS rising, fr and other jvm tools can help you to see what specific memory space it may be. I’ll hold off detailing that while we await your confirmation.
I tried it again and now the service will start. I removed them however and wanted to show everyone what the environment looks like without any tuning. Current screenshot of server memory below. I would like to know if I set the max memory why is the service consuming much more than what I am allocating? Is this normal behavior?
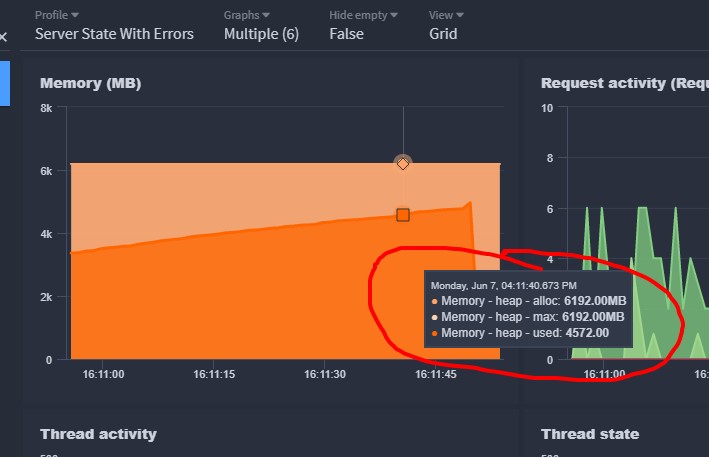
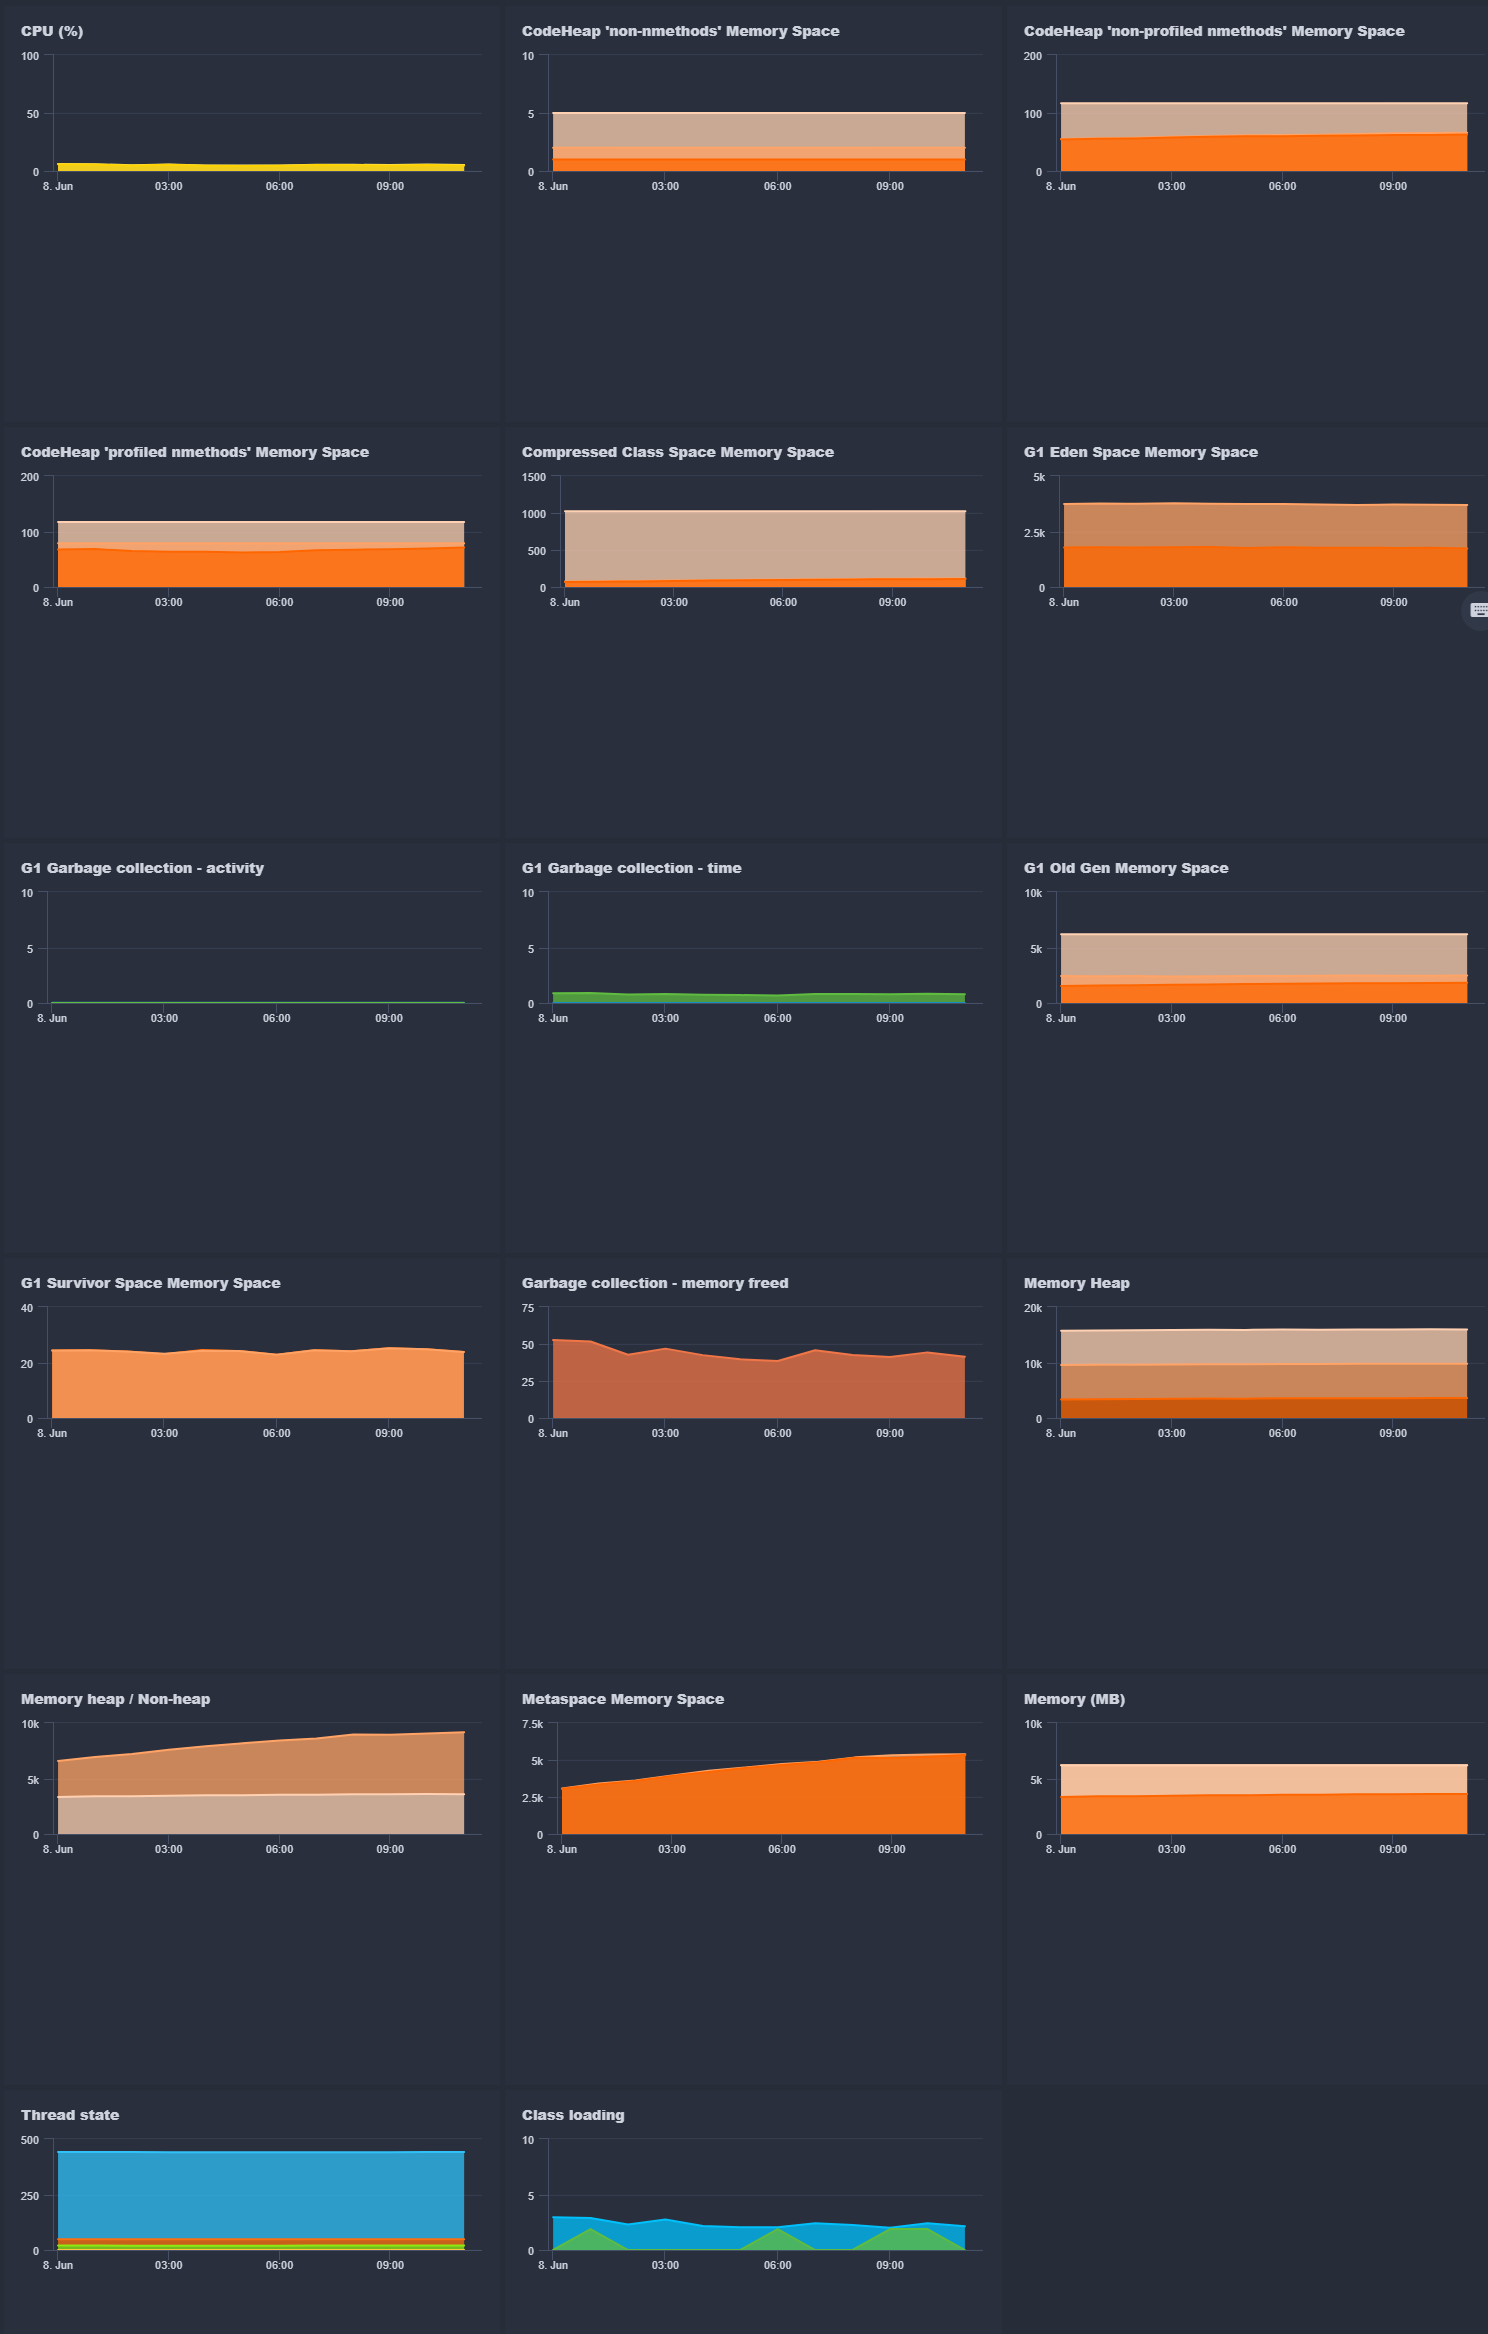
This screenshot is from FR today will all the memory graphs I had available.
First, as for what Zack said in reply just now, upgrading may well take care of some aspects of what you’re experiencing. I want to be clear I’m not arguing against that
But second, are you contending that these screenshots reflect a Lucee instance where you feel you configured a 6g max heap? I ask because while I do see that your earlier message today showed a screenshot where when you showed the “memory” graph there (and you also showed the popup that clearly showed you had a 6g max), among the various memory graphs now shown, we can see that the oldgen has about 6g max and the eden shows to be about 3.5g max. There were no popups so I am having to estimate from the y axis. That adds up to 9.5 (and is not including also the survivor space, which shows to be far less than a gig). Those are the 3 primary spaces that make up the heap, so I’m just saying that if those add up to 9.5 (for their max), then it can’t be that your heap max (set in the luceew.exe/tomcat9w.exe) was only 6g. Again, that may have been true for the earlier screenshot, but it seems it can’t be for these. Can you check out that same memory graph, comparing it (then) to what you see for the same memory values in these?
Third, let me now address your concern about how task mgr shows lucee (tomcat/that apache commons daemon service) using 10g. That actually does NOT have to do with the max heap sizes I was just discussing–at least in that the process won’t use that max simply because it’s declared to be that high. Instead, it would reflect what aspects of Java memory spaces were ALLOCATED at that time.
So let’s look at that:
The graphs show the heap ALLOCATED to be about 4g. (Most FR graphs for specific memory spaces will track 3 values: used, allocated, and max.) It’s the ALLOCATED amount (not the max or the used) that leads the JVM to show memory use in the process, such as in task manager
So the next question will be “why does it show 10g then?”, and that’s because of one more very large number among the various other memory spaces (and it’s one that is NOT in the heap): the metaspace. Note that it shows (in your graphs) to have allocated (and used) about 6g. So that plus the heap is about your 10g (there are also other elements of memory use in a process that are neither of these, but usually these are the big contributors)
And you may know that since Java 8 there has been a maxmetaspacesize jvm arg, which if set would limit how large that can be. I suspect you have none, which means it can grow as large as it wants…and unlike the old permgen (maxpermsize) in Java 7 and earlier, the metaspace is obtained from available memory on the box. While you could try to limit it, you would just then get an outofmemory error in the JVM when you hit that metaspace max, so that’s not really a “solution”
So lastly, a question would be “how can I stop Lucee/the jvm from using so much metaspace”:
I think that’s part of what Zack was getting at (far more succinctly) in proposing you update Lucee. And I assume that’s for the fix discussed in that jira ticket you pointed to yesterday, about non-heap memory rising. Only one of the 100+ comments in that ticket mentioned metaspace (from Brad, in December), so it’s not clear that that fix will address such high metaspace use, but it may, so it’s definitely worth a shot
I will add that in CF, I have often helped people solve similar metaspace issues by simply getting them to set the “template cache size” value larger, because if they have “save class files” enabled and we see the cfclasses folder having far more files in it than that size set in the admin (for how many can be held in memory), that nearly always will indicate a problem where the cache will fill, and then it will thrash, which causes excessive classloading, which puts pressure on the metaspace (not the heap), just like it used to on the permsize in Java 7.
(I didn’t weigh in on that ticket because I was not aware of it until you pointed it out yesterday, and by then it seemed moot to comment since there was a fix for a seeming bug. If it does NOT solve it, then I would wonder if there may be an equivalent issue in Lucee. I will note that FR can not only let you track the metaspace size and classloading, but with CF at least it also tracked the count of files in the template cache in memory, all of which can be a clue to this problem.)
I know that was a lot to take in. These sort of problems often involve a lot of moving parts, and some topics take more time to clarify than brevity will allow. Looking forward to how things go for you.