This is minor, but it would be helpful, especially when doing bug reports, to have the current engine version always available in the administrator. It could be added at the top of the sidebar, or somewhere in the header or footer. For some reason, switching pages in the administrator takes a very long time so one less click would be great.
Not to hijack your thread, but I did want to chime in and ask: why does it take so long to change pages in the Lucee admin? Especially when hitting the extensions page for the first time…
The extension page is slow because Lucee makes an HTTP request out to all your extension providers and asks them for the current list of available packages. I don’t know why any other pages would be slow though. Use the FusionReactor profiler and find out ![]()
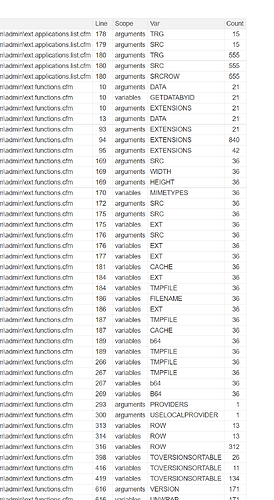
Implicit variable access in hot code (i.e used a lot in a loop) strikes again…
enable debugging, append debug=true to the url, check the logs
simply scope the arguments in this hot function
function addRow(src,trg,srcRow) {
		var trgRow=queryAddRow(trg);
		loop array=queryColumnArray(src) item="local.col" {
			querySetCell(trg,col,queryGetCell(src,col,srcRow),trgRow);
		}
	}
to
	function addRow(src,trg,srcRow) {
		var trgRow=queryAddRow(arguments.trg);
		loop array=queryColumnArray(arguments.src) item="local.col" {
			querySetCell(arguments.trg,col,queryGetCell(arguments.src,col,arguments.srcRow),trgRow);
		}
	}
and the page runs 25% faster
Pull Request drastically improve load time for extension page LDEV-2377 by zspitzer · Pull Request #724 · lucee/Lucee · GitHub
Page load times goes down from over 2s to just 265ms for me locally.
Lucee actually caches the provider responses, which makes testing this easier, but
it also currently caches bad provider responses, see [LDEV-2301] - Lucee
What exactly are you looking at in the variables chart to spot an improperly scoped variable?
Only unscoped variables are reported? The ones with higher counts are the low hanging, easy big performance wins.
That is good information and it’s not immediately obvious from the term “implicit variable access”. While the term is technically correct, “un/non-scoped variable access” would more clearly indicate a problem that needs to be resolved. Adding (impacts performance) as a further clue could also draw attention more clearly since you have room above that table. “Performance degradation from unscoped variables” would also fit and would leave no room for doubt.
Also, I see several methods in this list - should/can methods be called using variables.methodName()? If not, perhaps they should be excluded.
You don’t have to, but being explicit about scopes is always going to be faster, otherwise, there’s always going to be a potential lookup involved, even if it hits the nearest scope.
I agree the naming could be definitely improved, I filed a bug about showing the total number of scope problems on the debugging list in the admin [LDEV-2368] - Lucee so you can easily see where potential problems lie.
I also mentioned that language could be improved in that issue.
Do you want to file a PR to improve the language? Unscoped variable lookups is probably the clearest term, then adding something to the modern debugging template indicating this may affect performance would be good.
