Has anyone else experienced Lucee using a lot more memory since upgrading from 5.3.5.78 to .92?
We’ve been on a code freeze so don’t think it’s anything we’ve done, but suddenly our EC2s started running out of RAM and going into swap on 2 instances. Despite setenv.sh settings of a 2 gig max, Lucee keeps shooting up to 6+ gigs.
Any tips on how to do that? It happened on two different instances with completely different code bases/sites and resolved when we downgraded back to .78.
Good tip Zac, I don’t even think I knew that. I usually use jmap to generate a heap dump.
jmap -dump:live,file=C:/heapdump.bin <PID>
Replace the path to where you want to write the dump and the PID of the java process.
It requires you have JDK installed. Heap dumps are a binary file as big as your heap was and you can analyze it with something like the Eclipse Memory Analyzer Tool (MAT). The binary files zip very well. This is not for the faint of heart though. I’d spend a couple minutes to take a look if you want to send it to me, but don’t post the heap dump publicly since it contains everything in your server’s memory which includes potentially sensitive stuff.
Hi Zac,
in my case it has nothing to do with debugging.
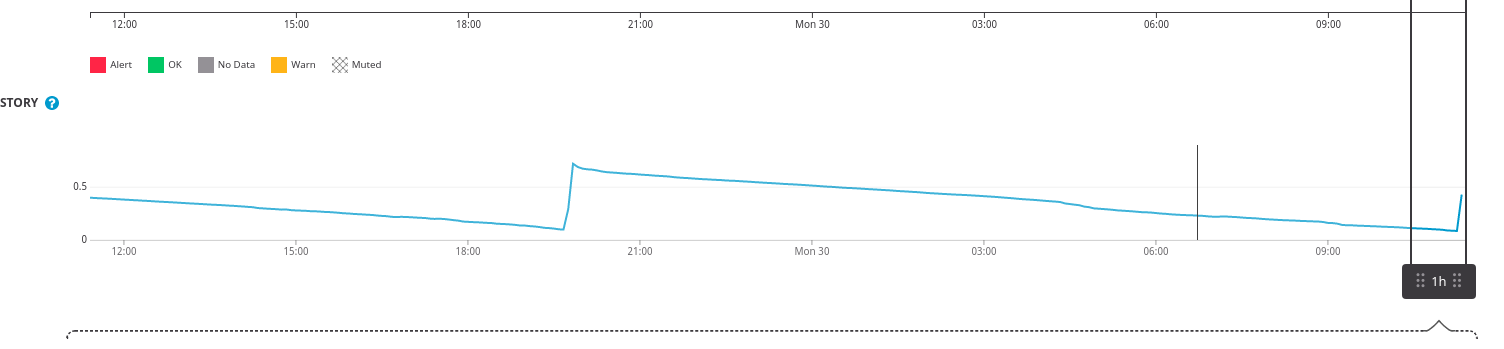
But increasing memory usage, more than limited in heap settings, is what I can see (and rd444 reports).
It was definitely the Lucee process on Linux as restarting it would reset it. Memory debugging is above my skill level. Our setenv.sh was set to a max on one server of 1 gig, and another at 2 gigs and both had Lucee using over 5 gigs.
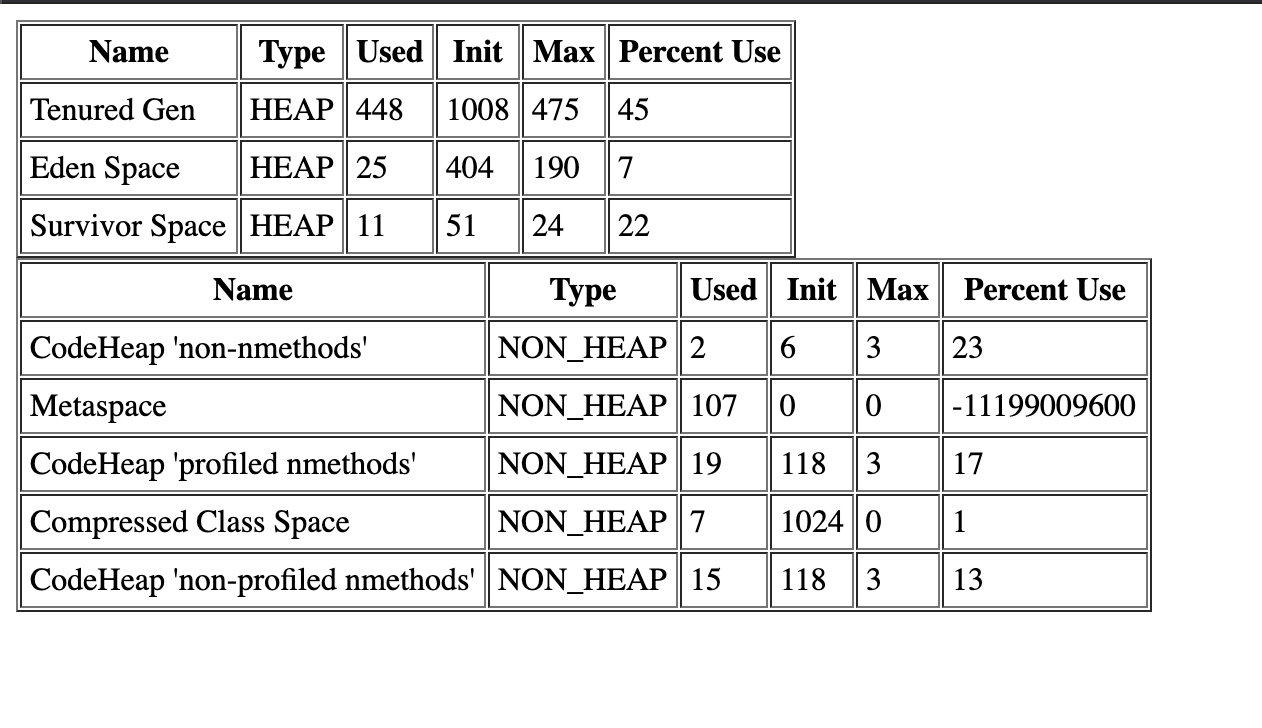
We had to downgrade on our production servers and haven’t been able to schedule a test there. Here’s the output from our dev server, though it doesn’t have live traffic going against it so might be useless info:
Just before the closing </cfloop>. I’ve got a schedules tasks on that page, so I write a log file with the memory consumption. Although this will not stop the server from crashing, you can at least see, what part of memory fills up.