Hi,
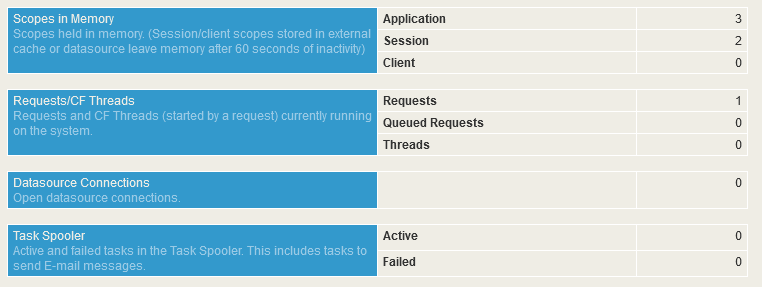
Is that normal that the server admin and web admin overview shows 0 for requests and datasources connections? Note that there is users currently using the web application.
Same about the task spooler. It stay at 0 no matter what.
Thank you!
OS: Windows Server 2016 (10.0) 64bit
Java Version: 1.8.0_181 (Oracle Corporation) 64bit
Tomcat Version: Apache Tomcat/8.5.33
Lucee Version: Lucee 5.3.8.206
As with your previous mail tasks question, my suspicion would be that you’re not looking at the right web admin. Each context has its own.
Go to your server admin and on the home page scroll down to the bottom for a list of all the web contexts defined.
I think you are right. I was confuse about it. I thought it was about Server admin vs Web admin.
I currently have 2 elements under Web contexts. I masked the real domain name.
First one
http://127.0.0.1:8888 with a link to http://127.0.0.1:8888/lucee/admin/web.cfm and the webroot is C:\lucee\tomcat\webapps\ROOT.
Second one
https://xxx.example.net/lucee/admin/web.cfm and the webroot is T:\inetpub\wwwroot\example
I can access the first one without problem and manage the scheduled tasks.
I can’t access the second one because I locked down Lucee in IIS for this domain. I suppose if I allow my IP I will be able to access it and see the requests and datasources connections correctly. I will test this tonight and if it is positive I will come back and indicate your answer as the solution.
Thank you!
You don’t need to go through IIS to access the web admin. Just use port 8888 like the first one to go straight through to Tomcat, i.e. http://xxx.example.net:8888/lucee/admin/web.cfm
Note it’s http not https as Tomcat presumably isn’t configured for SSL.
It works! I see the datasource connections. Thank you @Julian_Halliwell
2 Likes