The CPU usage on each of our Lucee instances intermittently peaks at 100%. That lasts for half an hour to an hour, then settles at around 30 to 50%. That is still a relatively high value. We therefore need your advice on benchmarking to resolve this.
We have seen that the peak CPU results from a surge of requests from the load balancer to a particular instance. I have searched the web for some time, but have been unable to find adequate information on which Lucee settings to tweak. That is. a setting depending on the request load of your web site.
Our Lucee instance - on production - runs comfortably on 18.4 GB heap-size. The load varies from 0 to over 40 simultaneous requests. Our settings are mostly default. This includes, according to JMX MBean, a (“XNIO-1”) thread-pool size of 30.
When the number of simultaneous requests exceeds 30, we see a rise in CPU usage.
We would be grateful for your advice on:
which settings to tweak to accommodate 40+ simultaneous requests;
Thanks. The traffic pattern is predictable, really. The CPU-challenged application serves secondary schools. The application consists of 16 Lucee instances, to which a load-balancer routes requests.
From Monday to Friday, users begin to drop in from 5 A.M… Peak load is usually between 10 A.M. and 1 P.M., each Lucee instance processing more than 40 simultaneous requests.
Thanks. I get you.
We’re of course on the look out for bottle-necks and for any places where the code can be further optimized.
Nevertheless, we need to know the vital benchmarks/settings. That is, the vital numbers.
That way we will be able to prevent the application from biting off more than it can chew.
You don’t need to set either of those undertow settings, the maxrequests actually sets the worker threads for you, and the io threads is not likely part if your problem.
Back to your original question, you’re going about it a bit wrong. You’re searching for solutions to a problem you have yet to identify. The symptom is high CPU, but the question is why. For this, you need a tool like FusionReactor which is indispensable when it comes to quickly answering these sort of questions.
If you don’t have FR (and won’t/can’t get it), then your next best thing is to start analyzing thread dumps. When CPU is high, the threads don’t lie. (hey, I rhymed!)
Once you know what is consuming the CPU (and it may be something you’d never think of) then we can talk about fixing it. But one thing is for sure, if your CPU can’t handle 30 concurrent requests, you don’t want to increase the number! So I wouldn’t touch the maxRequests setting yet.
We have FusionReactor. We have in fact been using it, together with thread-dump analysis.
You’re right when you say that a high-consuming thread may be something you’d never think of. We have indeed found many such. After all, we’re dealing with an application containing many millions of lines of CFML code, originally in Adobe ColdFusion.
@bdw429s : But one thing is for sure, if your CPU can’t handle 30 concurrent requests, you don’t want to increase the number! So I wouldn’t touch the maxRequests setting yet.
Hah! I am pleased to read that, being new to Lucee and CommandBox. Nice to know there is hope yet. We shall therefore leave the settings as they are, for the time being, and continue to look for any remaining bottle-necks, wayward requests and long-running threads.
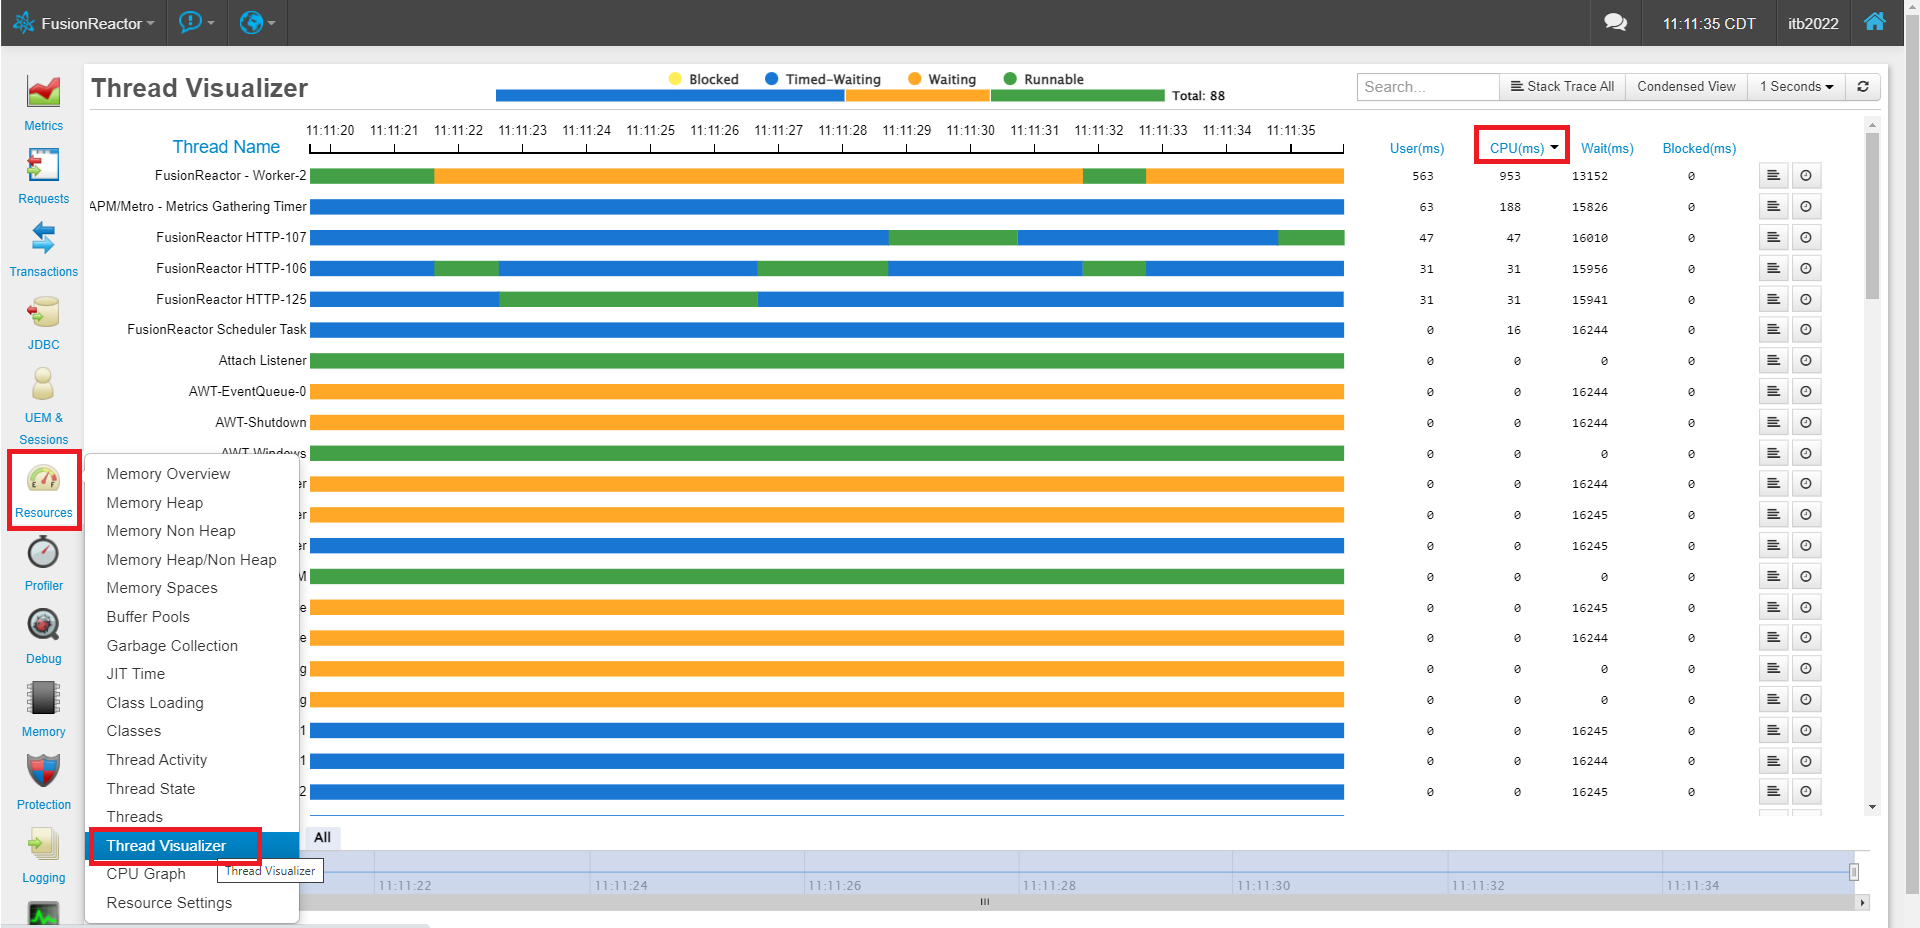
If there is one particular long-running thread really eating up the CPU, this will show you. For example, there were bugs in the past with the Lucee Controller thread where it would get stuck in a loop and church CPU, but it wasn’t related to any running HTTP requests, so you’d never see it if you were only focusing in the “web request” portion of FR.
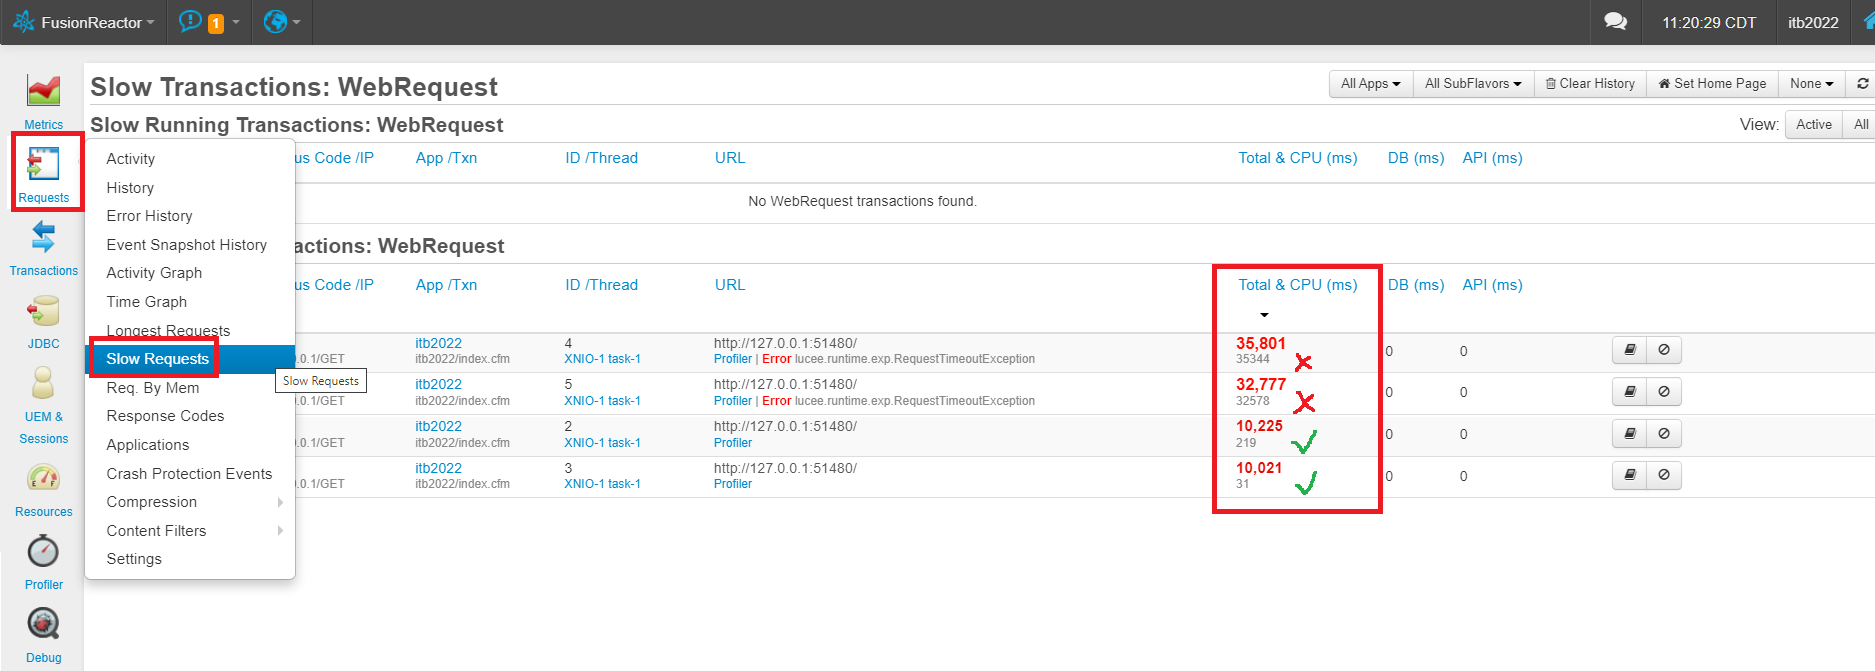
If there are no particular threads that seem to be consuming the lion’s share of CPU, then it may be a mixture of slow threads. Next, I’d look under “Requests” > “Slow Requests” and sort the Time/CPU column descecding. Look not just for slow requests, but slow requests that specifically used a high amount of CPU. You can see in my example two requests were slow, but used little CPU (I used a sleep() to mimic this) and two of them were slow and also used high CPU (I created a very long loop there).
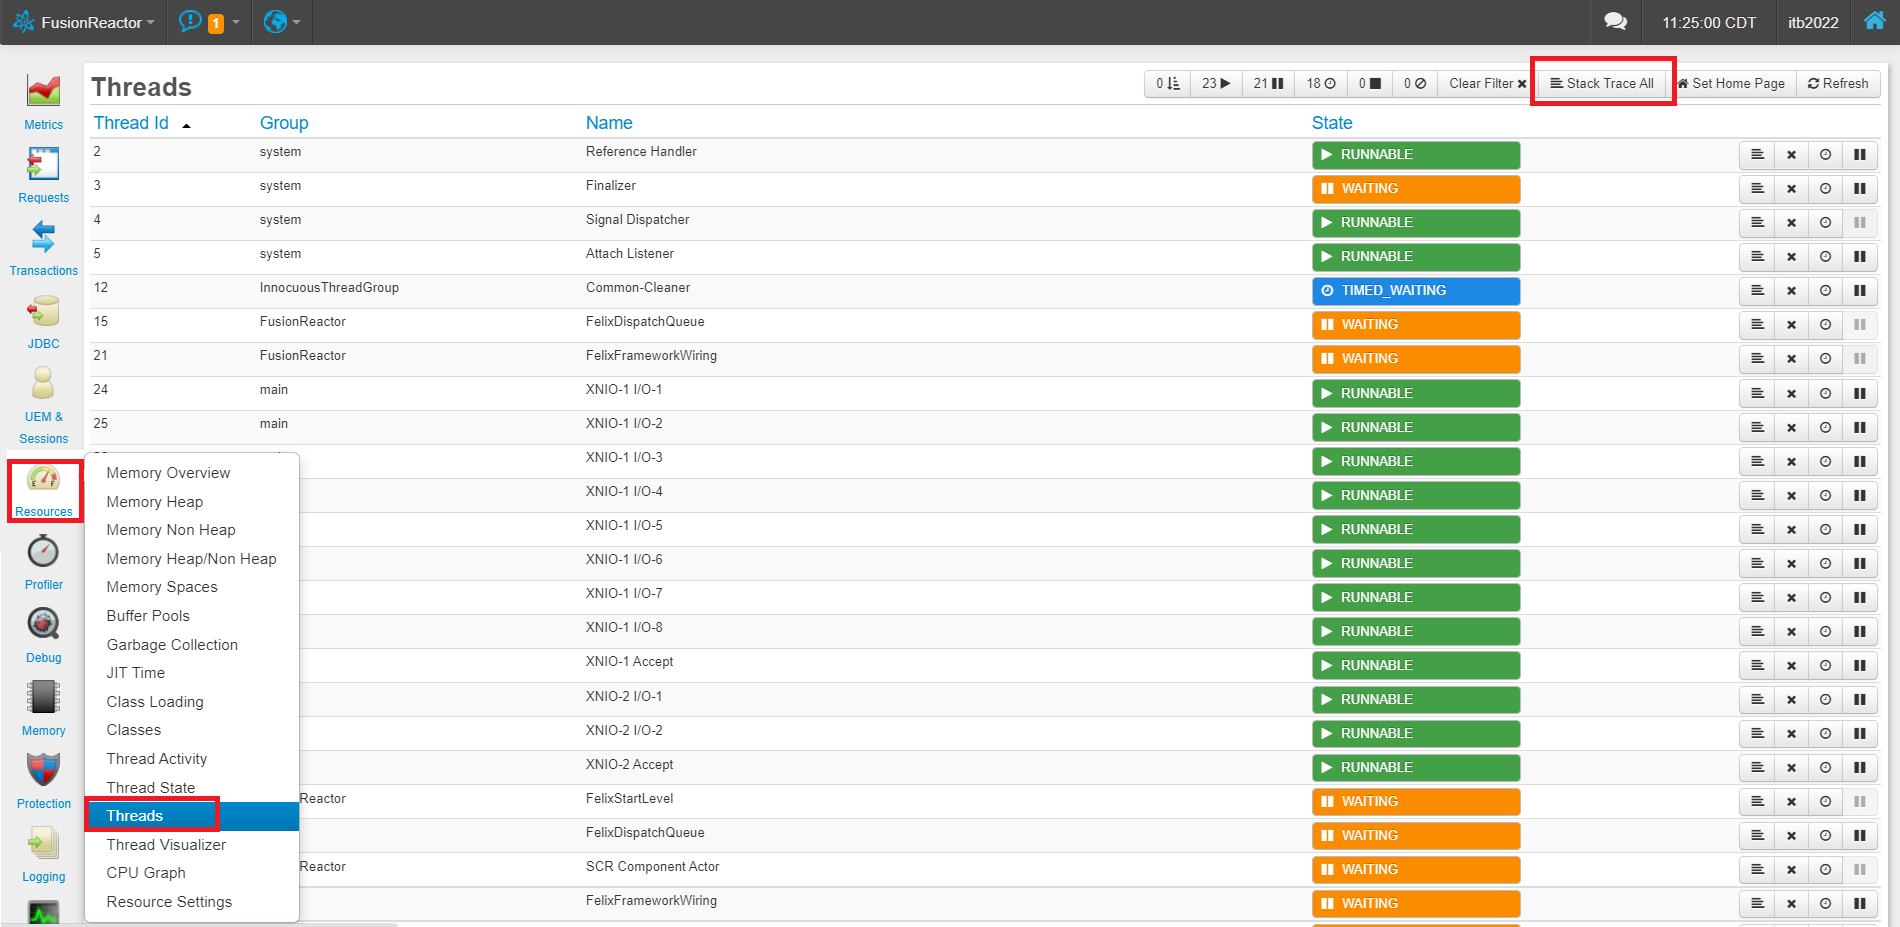
If there is not a large number of slow requests, it’s possible you just have some CPU intensive logic running in a large number of faster threads. Keep in mind, waiting on a DB call, or HTTP, or a CFLock uses almost no CPU at all. For this, while the server is under load, to go to “Resources” > “Threads” and click “Stack Trace All” and wait a second while it captures a full thread dump.
This step isn’t nearly as scientific, but scan through all the running threads in the JVM and look for patterns or repeated stacks that show one thing in particular which seems to be running often. Just because you see many threads doing something doesn’t mean it’s consuming CPU, but it’s a good place to start looking for clues.
And finally, for any given thread that is slow, I highly recommend the FusionReactor Profiler feature, which I have a full screencast on how to use here:
I missed this thread until now. Good stuff, indeed. For the sake of completeness, and for any who may well bookmark the thread or find it later when solving other cpu issues with lucee (or cf), I had done an elaborated post on many possibilities and solutions–also suggesting FR of course, and other alternatives.
It covers still more things than discussed here, and while some might seem to relate to BKBK’s observed pattern (of it happening when reaching a large number of requests), others msy. Then again, he may not have found it in searching for Lucee–as it was written in 2014, so I referred instead then to Railo. I will update that.
And though it’s so old, the content is all still relevant. (As for FR, it has indeed evolved since then and both the “threads vizualizer” and profiling features Brad mentioned are new since then, so I’d not mentioned them. Really glad he did, but note those are in the Ultimate or Developer edition, not in Standard or Enterprise.)
I should reprise and update that post (and others): I realize that many will dismiss something several years old, presuming it’s not likely still relevant. But like many things in the cf/lucee world, some problems and their solutions are not necessarily new and different from back then.
Great to hear, BKBK. So with all that info, and especially what Brad has shared, have you narrowed down the problem? If not, I will say that this is the sort of thing I help people with daily. I do realize that many are unable or just disinclined to pay for assistance (or don’t feel they should have to).
Some problems are just hard to identify and resolve even in lots of back and forth in forums/slack/twitter–though I am game to keep trying, along with others here. I’m just saying that I would welcome the chance to help solve this for you, if you can’t on your own or we can’t here. And I have helped even very experienced people solve such knotty problems in less than an hour (but I can’t commit to that, not knowing what the problem is). It’s rare that problems take longer than a couple or a few.
More (including rates, approach, satisfaction guarantee, and more) at Charlie Arehart's Server Troubleshooting Consulting Services. Otherwise, please do keep us posted on your progress. Clearly, others are very interested to see how this movie ends.
I’m fine with that, but I’ll point out the steps I outlined where specifically intended to locate a source of high CPU, not necessarily to locate slow requests in general nor to tune high throughput.