just been having a look at the new debugging output in 5.3
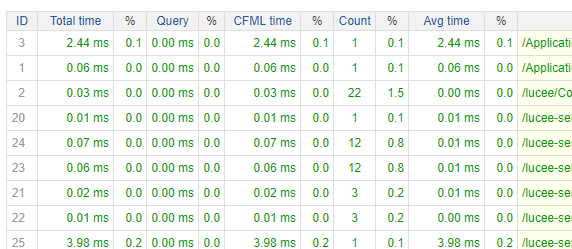
- the execution time debugging output shows total and average, could max be shown? that would be really useful for identifying when there’s an outlier which is blowing out the average?
- does every timing need to include the ms suffix?
- green on white background text for the execution time is hard to read
- there’s a lot of alerts which which feels rather clunky in 2018
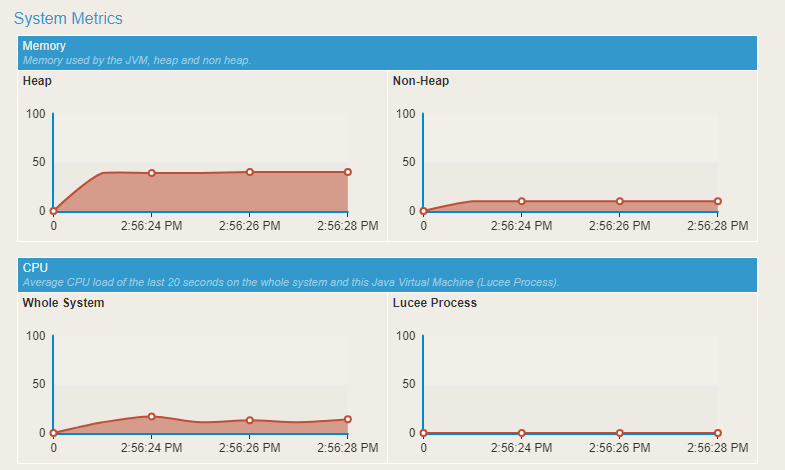
- the refresh interval for the new metrics graphs is rather high and I’m seeing a cpu load of 10-25% in chrome
- the debugging metrics polling and updating is always running, even when the metrics tab isn’t open, it should only update when the metrics tab is selected and the browser tab has focus
- could all the graph animation be disabled, it’s just distracting IMHO
I’ve got a nifty vanilla javascript table sorter function, would a PR request be accepted?
1 Like
why does this function expose server performance data even if debug is disabled?
http://127.0.0.1:4040/lucee-server/admin/debug/chartProcess.cfc?method=sysMetric
it returns {cpuProcess: 0,cpuSystem: 16,nonheap: 10,heap: 47}
the more I think about this feature, I think this request level debugging would be more useful if the metrics was just a static chart showing the performance history before, during and marking the start of rendering out the debug template, which often is more intensive that the actual request
i.e. the performance profile of the server before request started and then how the server performed during the request execution. the administrator overview is there to monitor real time performance
and as these four metrics graphs are all using the same x-axis, was it considered to combined them into a single graph so that a much longer time period can be displayed and relations between the metric can be more easily seen?
at the moment it’s 4 separate moving graphs of just 6s of data which is rather hard to digest
1 Like
I’ve filed [LDEV-1864] - Lucee with regards to the page requests metrics issues
the new debugging also breaks pages due to loading third party libraries
https://luceeserver.atlassian.net/browse/LDEV-1865
Small spelling corrections I suggest after viewing your (exciting!) video:
I agree about the green color and ms suffix. Didn’t get a chance to go over everything else yet.
If you add JavaScript code then it must be in the form of Progressive Enhancement, so that nothing important will be missing from the output. Also, it must be very small in size because we do not want to issue a separate http request for it, therefore it will be inlined.
I personally am in general against adding more JS code to those templates, but if it is very small and very useful then it might work.
p.s. You can always create a new debug template and add more JS code to that one, then users who have it installed can opt-in to use it. I’m just against having it in the default template.